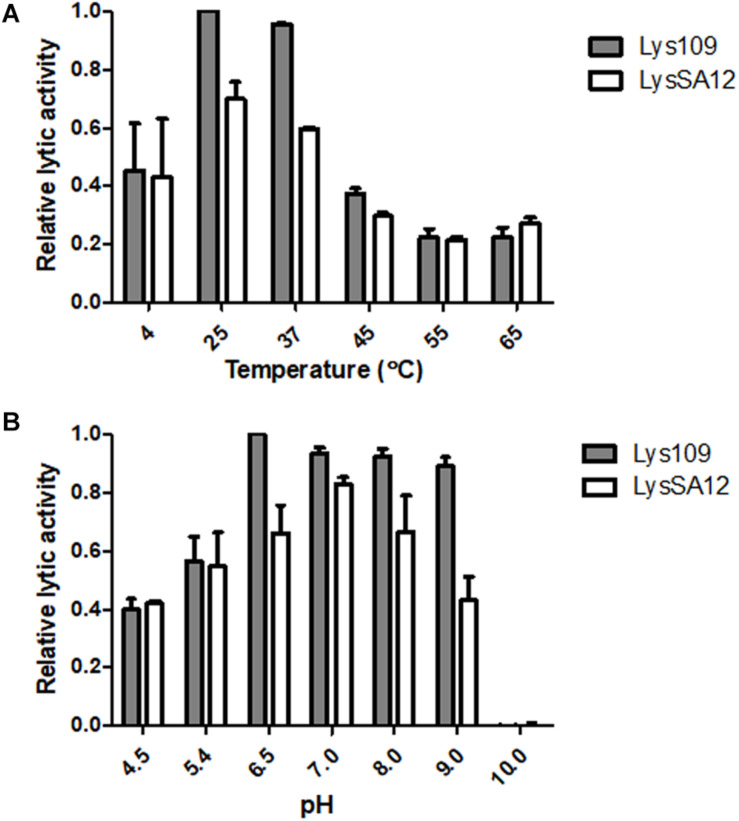
FIGURE 4.
The effects of temperature and pH on the lytic activity of Lys109 and LysSA12. The optimum (A) temperature and (B) pH of Lys109 and LysSA12 were examined by incubation of the enzymes (300 nM each) with target cells at different temperatures and in different pH buffers, respectively. The relative lytic activities were calculated using the activity of Lys109 assayed in a buffer at pH 6.5 and 25°C, which showed maximal activity.

