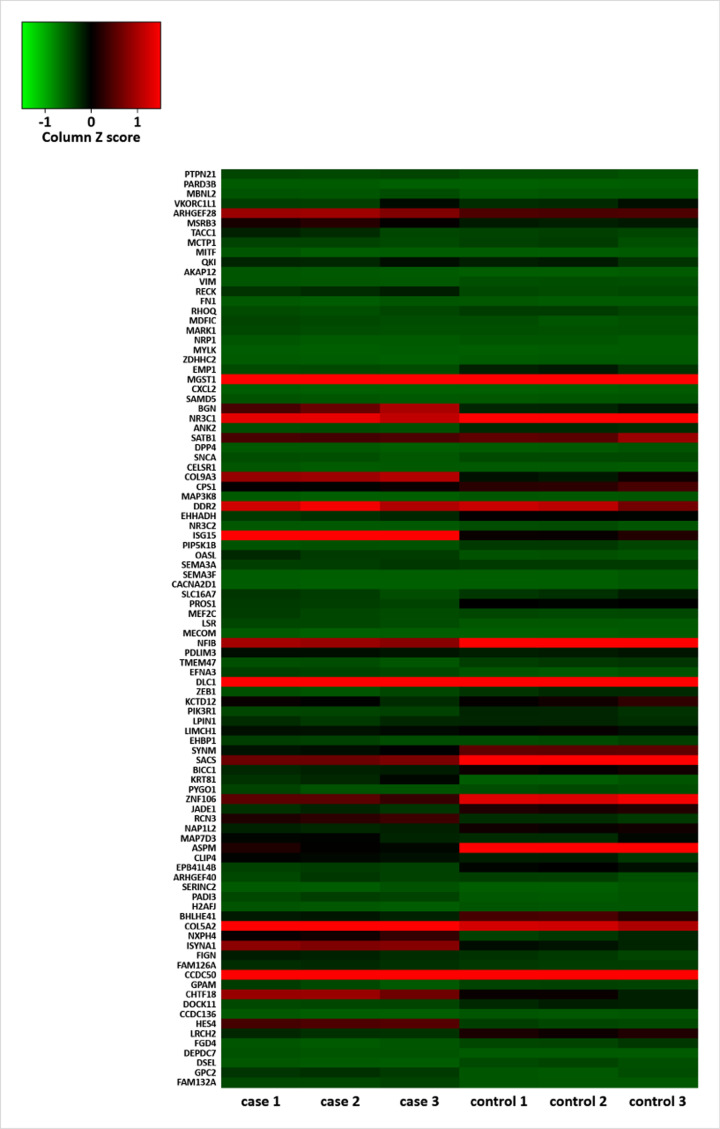
Figure 2. Heatmap of 94 mitochondria-related differential expressed genes in GSE128610.
Case 1, case 2 and case 3 were BC cell lines (MDA-MB-468), and control 1, control 2 and control 3 were BC-free epithelial cell lines (MCF10A). Individual values on the vertical axis represented mrDEGs. Green color represented down-regulated mrDEGs and red color represented up-regulated mrDEG; mrDEGs, mitochondria-related differential expressed genes.

