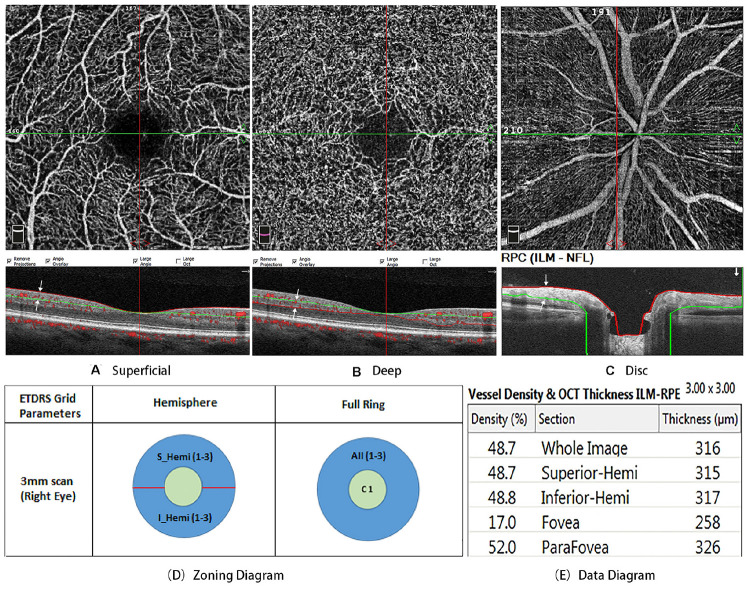
FIGURE 1.
(A) is the superficial en face image, which was segmented with an inner boundary at the internal limiting membrane (red line) and an outer boundary set at 10 mm above the inner plexiform layer (green line). (B) is the deep en face image, which segmented with an inner boundary at 10 mm above the inner plexiform layer (green line) and an outer boundary at 10 mm beneath the outer plexiform layer (red line). (C) is the radial peripapillary capillaries (RPCs), which was defined as extending from the internal limiting membrane to the posterior boundary of the RNFL. (D) is Zoning diagram two different modes of data analysis: hemisphere and full ring. (E) is data diagram. All scans were reviewed independently by two investigators to ensure correct segmentation and sufficient image quality.

