FIGURE 1.
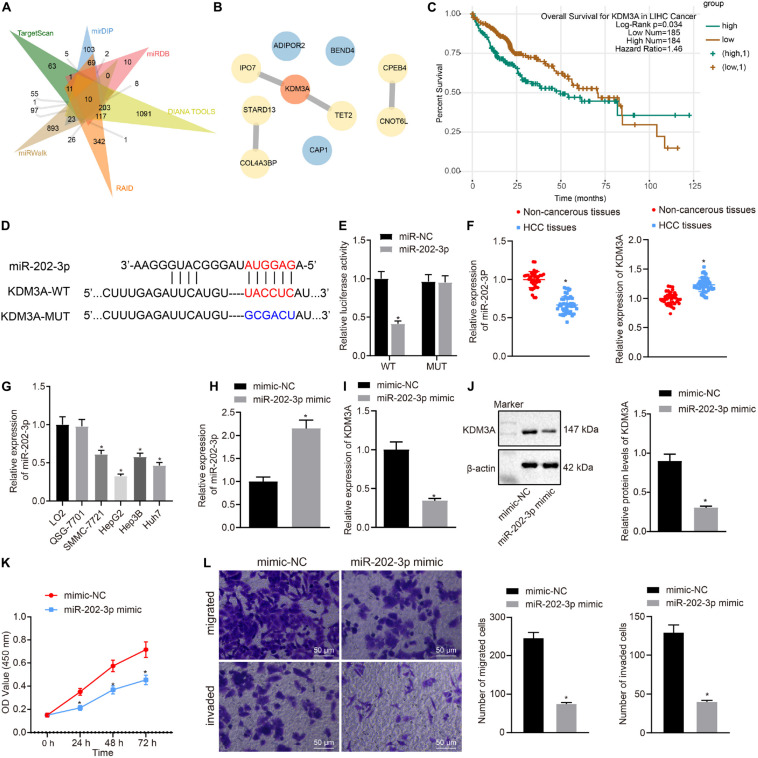
miR-202-3p targets KDM3A gene and inhibits HCC cell viability, migration, and invasion. (A) 10 common target genes of miR-202-3p were obtained among the TargetScan (Representative miRNA < –0.25; http://www.targetscan.org/vert_71/), mirDIP (Integrated Score > 0.3; http://ophid.utoronto.ca/mirDIP/), miRDB (Target Score > 80; http://www.mirdb.org/), DIANA TOOLS (miTG score > 0.5; http://diana.imis.athena-innovation.gr/DianaTools), RAID (Score > 0.6; http://www.rna-society.org/raid2/index.html), and miRWalk (bindingp = 1,energy < –20,accessibility < 0.01,au > 0.5; http://mirwalk.umm.uni-heidelberg.de/) databases by Venn diagram. (B) PPT network of 10 common target genes of miR-202-3p by the String database analysis, wherein the more red the color of the circle where the gene is located, the higher the degree of its core, while the more blue the color, the lower the core degree. (C) Survival curves of HCC patients according to KDM3A expression by the starBase database analysis (HR = 1.46, p = 0.034). (D) Putative miR-202-3p binding sites in the 3’UTR of KDM3A by the TargetScan database analysis. (E) Luciferase activity at the promoter of the reporter gene containing KDM3A-WT and KDM3A-MUT in the presence of miR-202-3p mimic or mimic-NC. * indicates p < 0.05 compared with KDM3A-WT + mimic-NC by Tukey’s test-corrected one-way ANOVA. (F) The expression of miR-202-3p and KDM3A mRNA was determined by qRT-PCR analysis in HCC tissues (n = 50) and tumor-free liver tissues (n = 38); * indicates p < 0.05 compared with tumor-free liver tissues by paired t-test. (G) The expression of miR-202-3p was determined by qRT-PCR analysis in cultured HCC cells SMMC7721, HepG2, Hep3B, Huh7, and two normal human liver cell line cell lines LO2 and QSG-7701. * indicates p < 0.05 compared with LO2 and QSG-7701 cell lines by Tukey’s test-corrected one-way ANOVA. (H–J) The expression of miR-202-3p and KDM3A was determined by qRT-PCR analysis and Western blot analysis in HepG2 cells following miR-202-3p mimic or mimic-NC treatment. * indicates p < 0.05 compared with mimic-NC. (K) HepG2 cell viability was evaluated by MTT assay at indicated time points. * indicates p < 0.05 compared with mimic-NC by Bonferroni-corrected repeated measures ANOVA. (L) Representative view (×200) of HepG2 cells migrating from upper transwell chambers without Matrigel into lower ones and statistics of migrating cells; representative view (×200) of HepG2 cells invading from Matrigel-coated upper transwell chambers into lower ones and statistics of invading cells.

