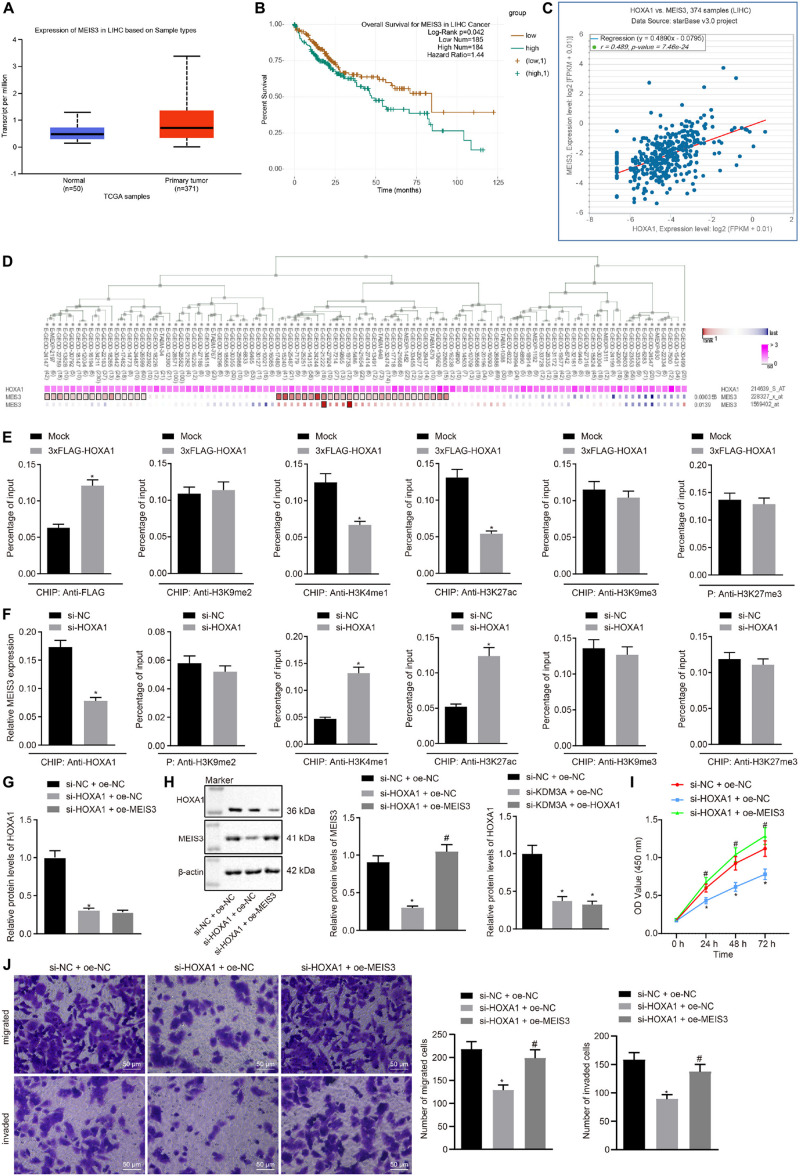
FIGURE 3.
HOXA1 promotes HCC cell viability, migration, and invasion by binding with the MEIS3 enhancer region. (A) Expression box of MEIS3 in HCC by the Ualcan database analysis. (B) Survival curves of HCC patients according to MEIS3 expression by the starBase database analysis (HR = 1.44, p = 0.042). (C) Positive correlation between HOXA1 and MEIS3 expression by the StarBase database analysis (r = 0.489, p = 7.46E-24). (D) Co-expression of HOXA1 and MEIS3 by the MEM analysis (p = 3.56E-04), wherein the abscissa represents different samples; the squares corresponding to the samples and KDM3A represent co-expression intensity of MEIS3 and HOXA1; the color of the squares was shown on the upper right, and the deeper the color, the stronger the co-expression intensity of the two; the right side of the squares represents the significance of overall intensity of MEIS3 and HOXA1. (E,F) ChIP analysis was performed using anti-H3K9me2, anti-H3K4me1, anti-H3K27ac, anti-H3K9me3, and anti-H3K27me3 antibodies in HepG2 cells treated with 3xFLAG-HOXA1 or HOXA1 siRNA. * indicates p < 0.05 compared with Mock or scramble siRNA by paired t-test. (G,H) Western blots and quantification of MEIS3 in HepG2 cells treated with HOXA1 siRNA and/or MEIS3 recombinant lentiviral expression vectors. (I) HepG2 cell viability was evaluated by MTT assay at indicated time points. (J) Representative view (×200) of HepG2 cells migrating from upper transwell chambers without Matrigel into lower ones and statistics of migrating cells; representative view (×200) of HepG2 cells invading from Matrigel-coated upper transwell chambers into lower ones and statistics of invading cells. * (compared with scramble siRNA + oe-NC) and # (compared with HOXA1 siRNA + oe-NC) indicate p < 0.05 by Tukey’s test-corrected one-way ANOVA for (G,H,J) and by Bonferroni-corrected repeated measures ANOVA for (I).

