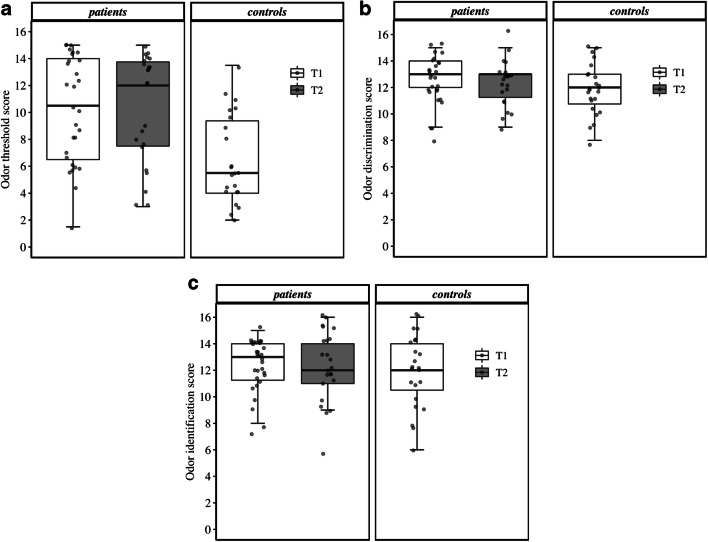
Fig. 1.
Boxplots for the three different smell tests: odor threshold (a), odor discrimination (b), and odor identification (c). The boxplots refer to the median score (midpoint of the scores), the first quartile of the scores (Q1, lower boundary of the box), and the third quartile of the scores (Q3, upper boundary of the box). The range of the box represents the interquartile range (IQR = Q3 – Q1), and the whiskers indicate what data points can be considered outliers. The upper whisker extends to the most extreme score no more than 1.5 times the IQR above Q3, and the lower whisker extends to the most extreme score no more than 1.5 times the IQR below Q1. Note that the data points represent individual scores and that these points were slightly jittered to avoid overplotting

