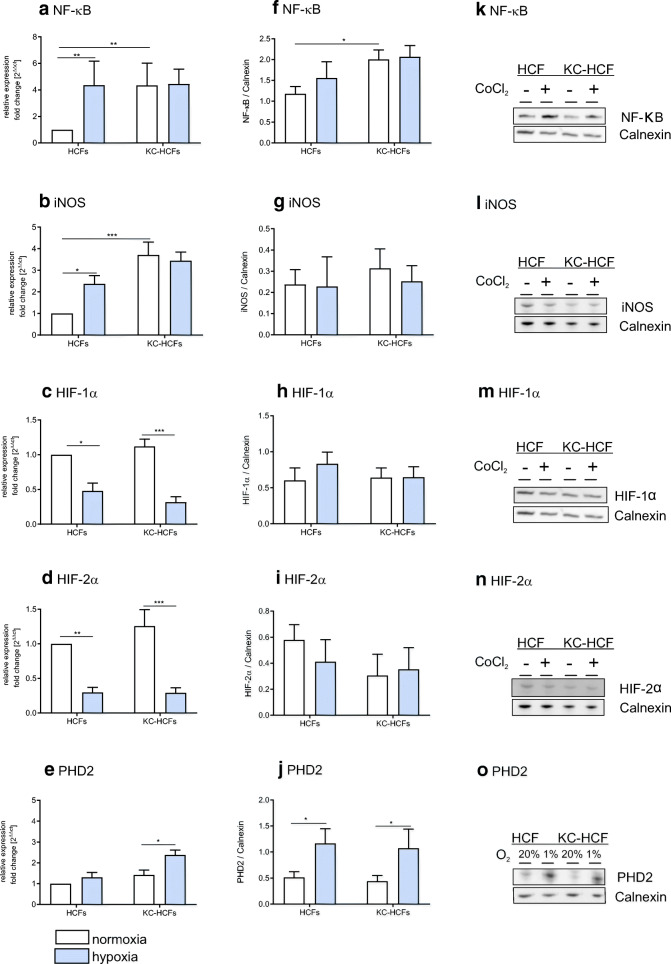
Fig. 3.
Effect of hypoxia on NF-κB, iNOS, HIF-1α, HIF-2α, and PHD2 mRNA and protein expression (normoxic conditions: white bars; hypoxic conditions: blue bars). Hypoxic conditions for human corneal fibroblasts (HCFs) and keratoconus human corneal fibroblasts (KC-HCFs) were performed using 150 μM CoCl2 for NF-κB (4 h), and iNOS, HIF-1α, and HIF-2α (48 h) for PHD2 1% O2 atmosphere were generated in a hypoxic chamber for 48 h. Significant differences are indicated. a–e Quantitative mRNA analysis of NF-κB, iNOS, HIF-1α, HIF-2α, and PHD2. Data show mean ± SEM of at least 8 independent experiments in duplicate. f–j Relative quantification of Western blot analysis. Calnexin was used as loading control and to calculate the relative protein expression levels. k–o Representative Western blots of NF-κB, iNOS, HIF-1α, HIF-2α, and PHD2 (*p < 0.05; **p < 0.01; ***p < 0.001)

