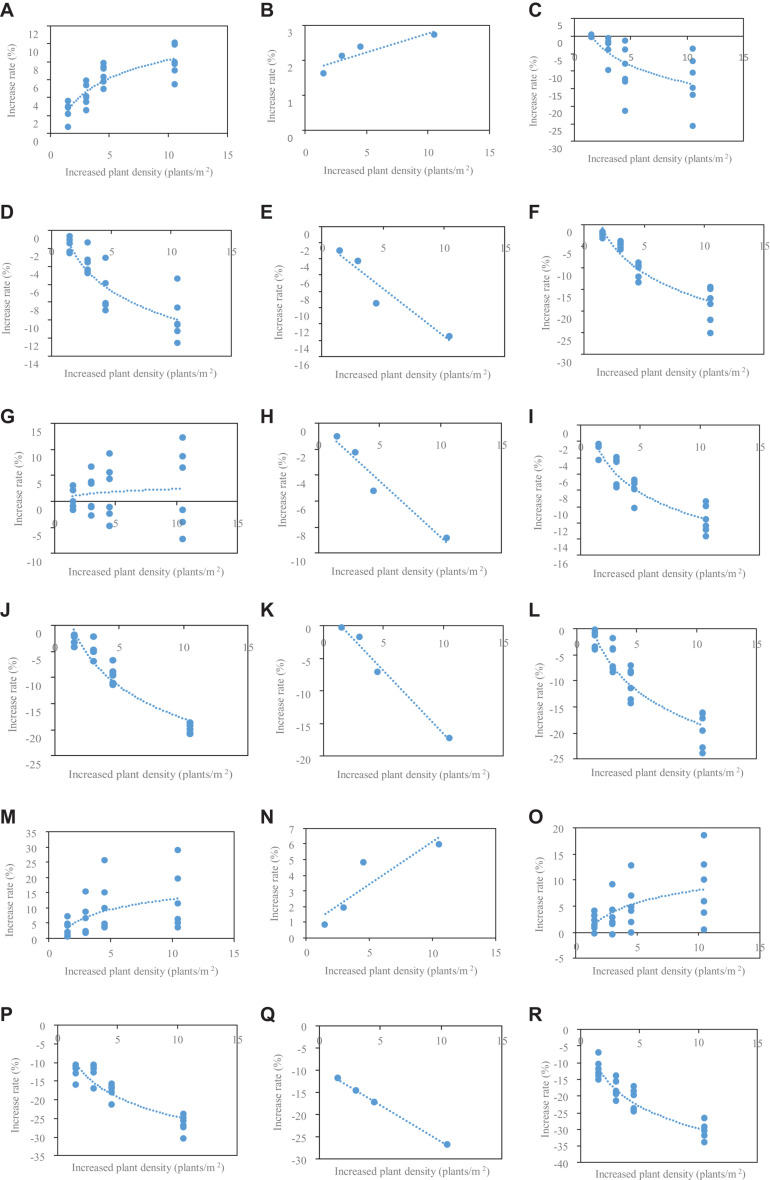
FIGURE 2.
The relationship between the rate of increased LL, lamina length; LW, lamina width; SL, sheath length; SW, sheath width; IL, internode length; and ID, internode diameter at phytomers 6–11 (A,D,G,J,M,P), 12 (B,E,H,K,N,Q), and 13–18 (C,F,I,L,O,R) at different densities relative to PD4.5 and increased value of different plant densities relative to 4.5 in 2016.

