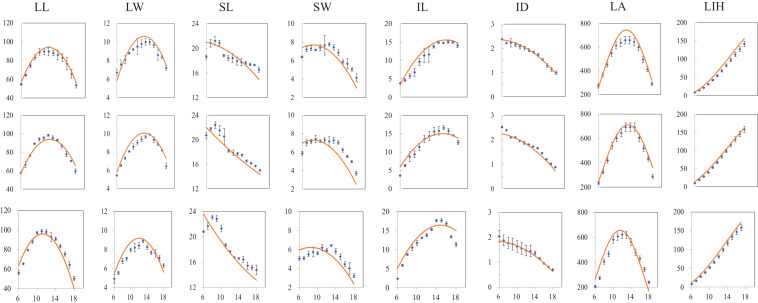
FIGURE 3.
Comparison of simulated (red curves) and measured (scattered dots) values of individual organs, i.e., LL, lamina length; LW, lamina width; SL, sheath length; SW, sheath width; IL, internode length; ID, internode diameter; LA, leaf area; and LIH, leaf inserting height; (vertical coordinate) at different plant densities (PDs) at full canopy expansion, exampled as PD4.5 (top subfigure layer), PD7.5 (middle subfigure layer), and PD15 (bottom subfigure layer) varying with phytomer position (horizontal coordinate) (All subfigures have x axis unit as phytomer position; vertical bars indicate standard errors).

