Fig. 3.

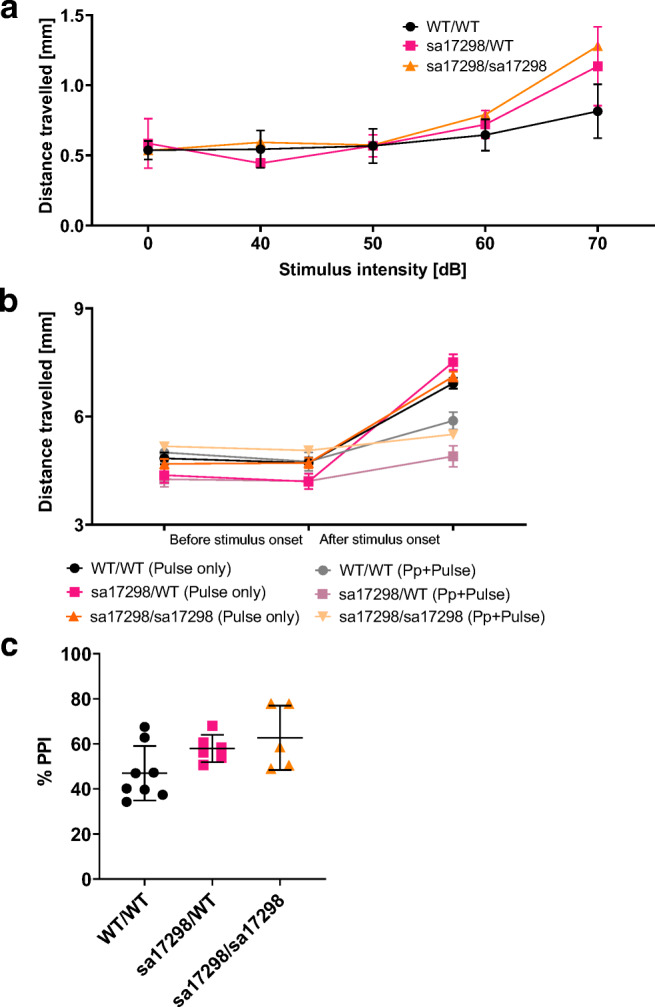
Acoustic startle response and PPI. a Graph of distance travelled when presented with different auditory stimuli. Data analysed using two-way ANOVA and presented as mean ± SEM. b Preceding a startle with a prepulse stimulus decreases the startle response of larvae. Data shown as mean ± SEM. c % PPI of larvae. One-way ANOVA revealed no overall significant difference among the groups. Tukey’s multiple comparison post hoc test however showed a strong tendency of homozygous mutant larvae towards significance (i.e. enhanced PPI). cacna1daWT/WT (N = 8), cacna1dasa17298/WT (N = 6) and cacna1dasa17298/sa17298 (N = 5), p > 0.05. Error bars represent mean ± SD. ASR, acoustic startle response; Pp, prepulse; PPI, prepulse inhibition. cacna1daWT/WT vs cacna1dasa17298/WT: p = 0.2002, cacna1daWT/WT vs cacna1dasa17298/sa17298: p = 0.0646, cacna1dasa17298/WT vs cacna1dasa17298/sa17298: p = 0.7702
