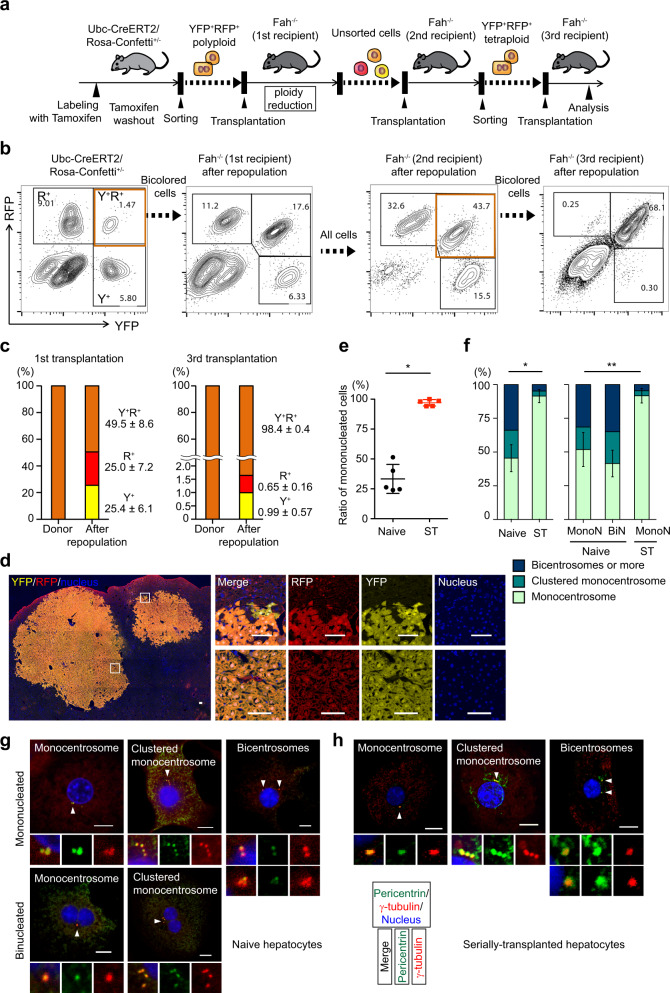
Fig. 2. Suppression of ploidy reduction in serially transplanted hepatocytes.
a Experimental scheme of serial transplantation. b Representative FACS plots of donor and serial recipient livers. The percentages of each fraction are shown. Note that proportion among colored cells is consistent before and after second transplantation, indicating similar proliferative capacity among colored cells. c Frequencies of colored cells before and after first and third transplantation. Values are means ± SD (n = 5 in the first transplantation, and n = 3 in third transplantation). d Microscopic images of tertiary recipient liver. Scale bars, 100 μm. e Ratio of mononucleated cells. Error bars indicate mean ± SD (n = 5 biologically independent mice in each group). *p = 3.0 × 10⁻⁶ (two-sided unpaired t-tests without adjustments for multiple comparisons). f Centrosome numbers in naive and serially transplanted tetraploid hepatocytes. Cells sorted from biologically independent mice were analyzed. Error bars indicate mean ± SD of monocentrosomal frequencies (n = 3 in naive hepatocytes, and n = 5 in serially transplanted hepatocytes). *p = 0.00014, **p = 0.018 (two-sided unpaired t-tests without adjustments for multiple comparisons). Representative microscopic images of centrosome staining of naïve hepatocytes (g) and serially transplanted hepatocytes (h). Scale bars, 10 μm. In (e–h), 494 serially transplanted hepatocytes (five mice) and 350 naive hepatocytes (four mice) were analyzed. Naive hepatocytes were collected from 12-week-old mice. Serially transplanted hepatocytes were collected from secondary or tertiary recipient mice by sorting bicolored polyploid cells. Y+ YFP+, R+ RFP+, ST serially transplanted, MonoN mononucleate, BiN binucleate. Source data are provided as a Source Data file.

