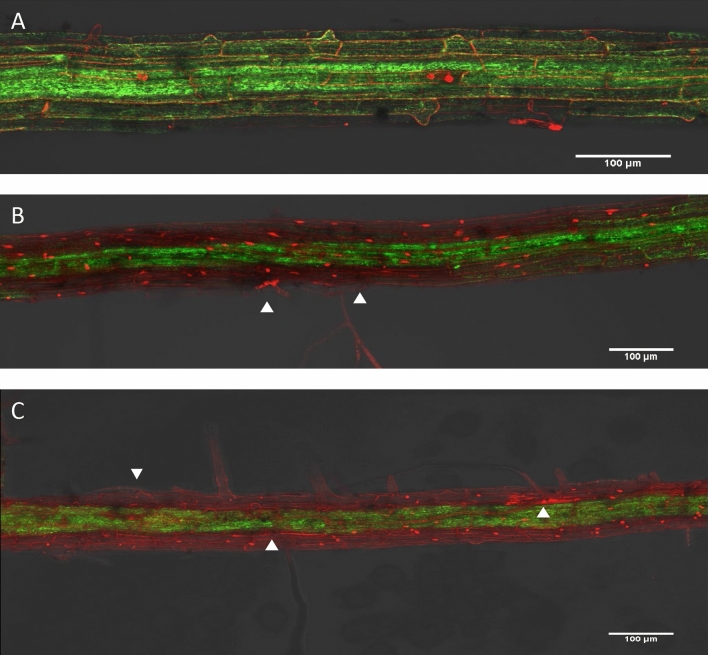
Figure 2.
(A) Mock, (B) AG8 and (C) AG2-1 infected mt-roGFP2 plants showing loss of GFP expression in the epidermal and cortical cells after R. solani infection. Images were collected 48 h after infection or mock treatment to capture fluorescence emission from GFP and propidium iodide (PI). Arrow heads represent location of infection hyphae. Scale bar represents 100 µm in all images. A minimum of 10 plants were imaged for each treatment and representative images were chosen.

