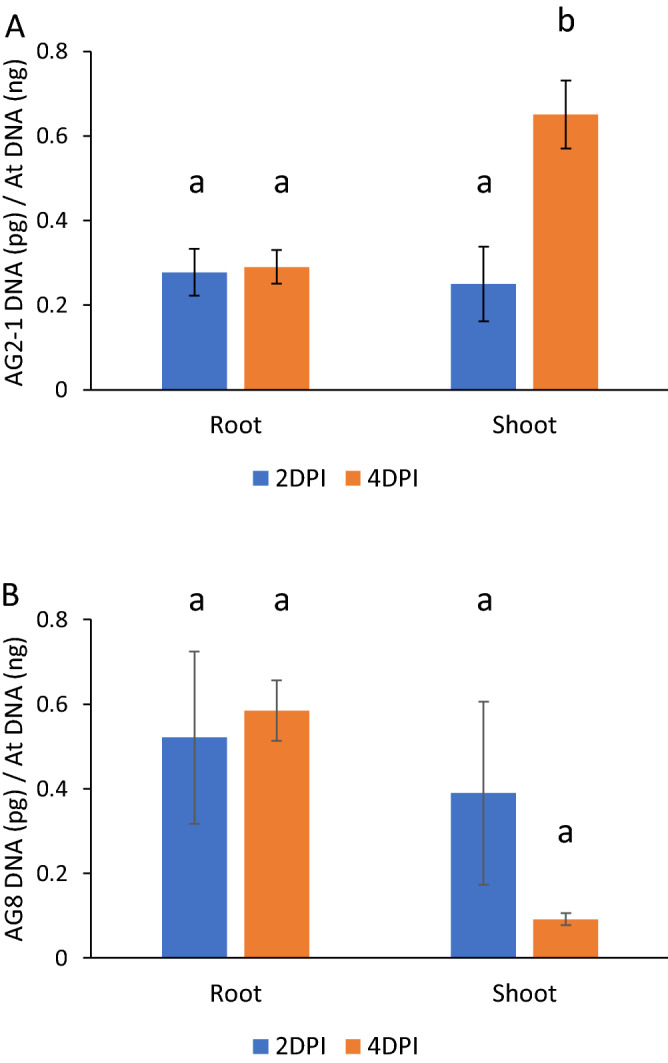
Figure 4.

Quantification of (A) AG2-1 and (B) AG8 biomass in A. thaliana Col-0 roots and shoots using qPCR. Col-0 plants were inoculated by planting the roots directly into infected vermiculite. After DNA extraction, pathogen DNA was amplified using R. solani ITS primer sequences and Arabidopsis DNA amplified using beta-Tublulin primer sequences. The Y-axis represents relative abundance of R. solani DNA (picograms) versus A. thaliana DNA (nanograms) determined using a standard curve derived from cultured R. solani tissue and A. thaliana genomic DNA. Bars with differing letters represent a significant difference (p < 0.05) using a one-way ANOVA and Tukey’s HSD test. Six biological replicates of forty plants were used per treatment and timepoint. Error bars represent standard error.
