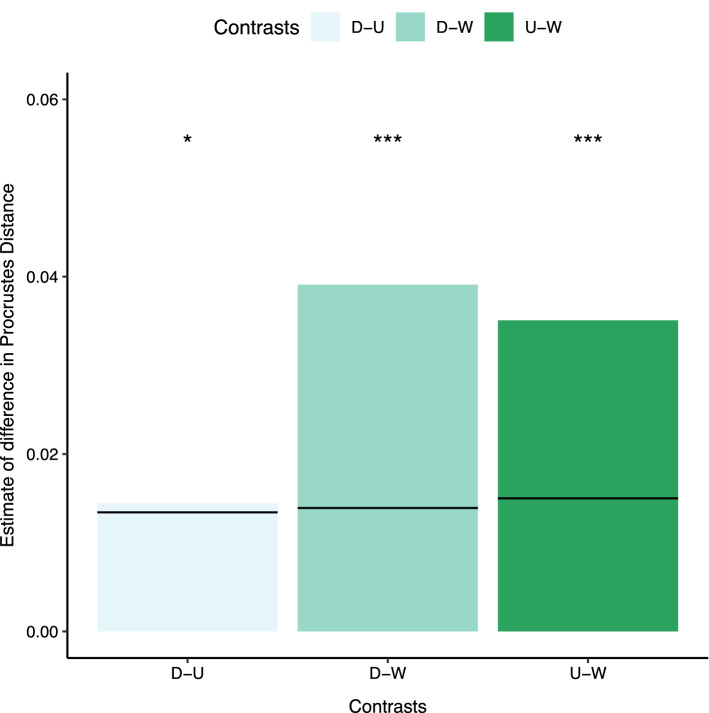
Figure 2.
Pairwise comparison of Procrustes distances between populations after a Procrustes MANOVA. D-U: difference between domesticated and unselected populations. D-W: difference between domesticated and wild populations. U-W: difference between unselected and wild populations Significance codes: *p < 0.05, **p < 0.01, ***p < 0.001. Horizontal lines on the graph represent the upper 95% confidence bound of the null hypothesis that the average Procrustes distances between two different populations is 0. Values that lie above these lines indicate a significant difference between the populations indicated in the contrast.

