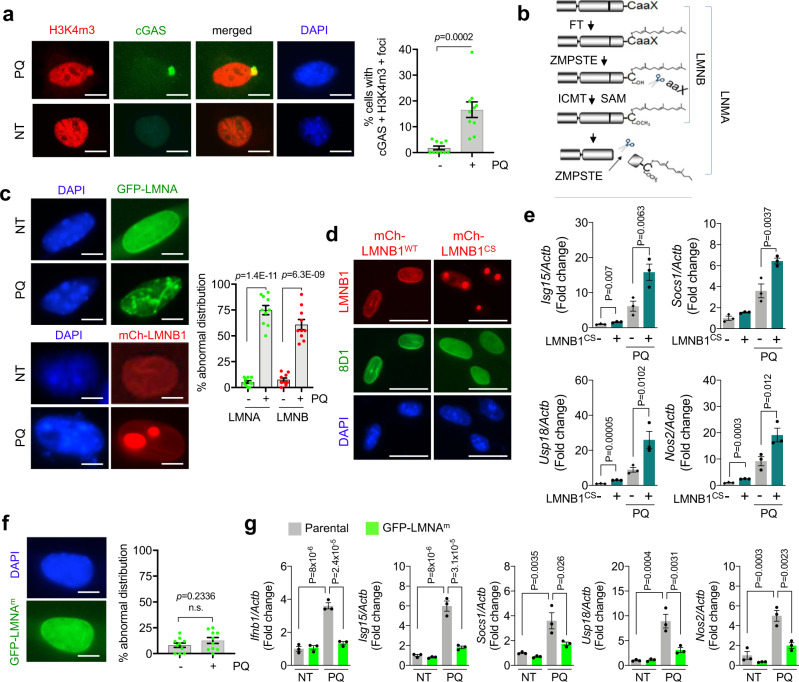
Fig. 4. Defective nuclear lamin processing causes nuclear leakage under oxidative stress.
a Left, analysis for cGAS-GFP reporter and IF of H3K4m3 following 24 h of PQ treatment. Right, quantitation of the percent of cells with cGAS-GFP foci overlapped cytosolic H3K4m3. Scale bar = 4 µm. Mean ± s.e.m. of ten images. b Diagram for lamin processing. FT: Farnesyl transferase, ZMPSTE: ZMPSTE24 protease, ICMT: Isoprenylcysteine carboxymethyltransferase, SAM: S-adenosyl-L-methionine. c Left, microscopic analysis for GFP-LMNA and mCherry-LMNB1 (mCh-LMNB1) localization following 24 h of PQ treatment. Right, quantitation for abnormal lamin structure ratio to whole cells. Scale bar = 2 µm. Mean ± s.e.m. of ten images. d IF for mature LMNB1 (8D1, green) in NSPCs expressing mCherry-tagged prelamin B1 (mCh-LMNB1WT) and mCherry-tagged mutant prelamin B1 (mCh-LMNB1cs). Scale bar = 5 µm. e qRT-PCR analysis for ISGs after 4 days of PQ treatment. Mean ± s.e.m. of three independent experiments. f Left, microscopic analysis of NSPC expressing mature LMNA (GFP-LMNAm). Scale bar = 2 µm. Right, quantitation of GFP-LMNAm is plotted following 24 h of PQ treatment. Mean ± s.e.m. of ten images. g qRT-PCR results for ISGs after 4 day of PQ treatment. Mean ± s.e.m. of three independent experiments. Statistical significance was determined by two-sided unpaired t-test for a, c, and f and by one-way ANOVA for e and g. Experiments for a, c, d, and f were repeated three times independently with similar results and representative images/blots are shown.

