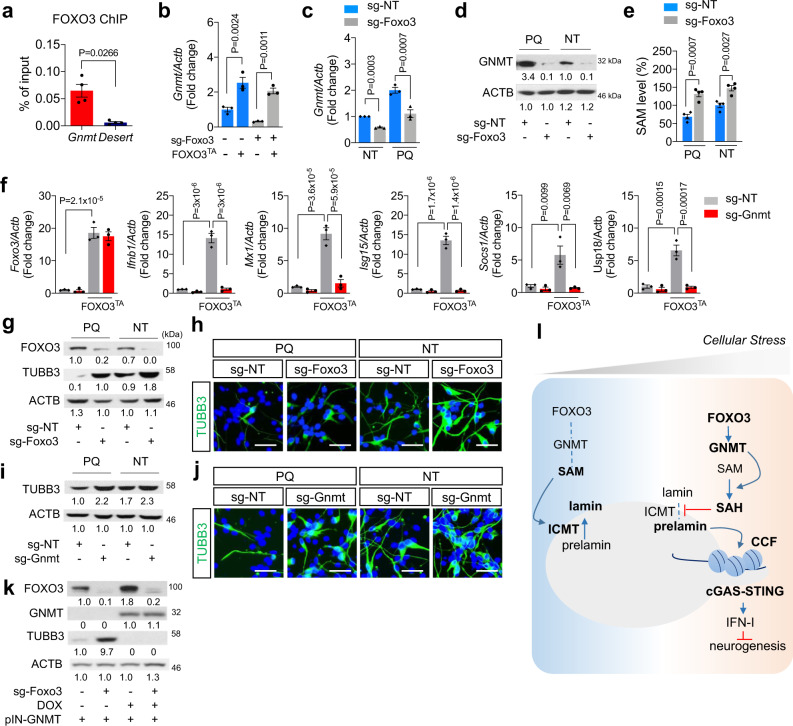
Fig. 7. Redox stress impacts neurogenic potential of NSPCs through regulating SAM levels.
a FOXO3 ChIP-qPCR analysis at Gnmt promoter in comparison to a gene desert region. Mean ± s.e.m. of four independent experiments. qRT-PCR (b, c) and WB (d) results for GNMT expression in NSPCs treated with PQ for 48 h. Mean ± s.e.m. of three independent experiments. e SAM levels in NSPCs expressing sg-NT or sg-Foxo3 treated for 48 h as indicated. Hundred percent of SAM = 50 µM. Mean ± s.e.m. of four independent experiments. f qRT-PCR results for Foxo3 and ISGs on either control adenovirus or FOXO3TA adenovirus-infected NSPC. Mean ± s.e.m. of three independent experiments. Statistical significance was determined by two-sided unpaired t-test for a and by one-way ANOVA for b, c, e, and f. WB (g, i, and k) and IF (h and j) for TUBB3 expressions of each NSPC line on 3 day of differentiation. Scale bar = 40 µm. Experiments for d, g, h, i, j, and k were repeated three times independently with similar results and representative images/blots are shown. k. Model for the mechanism how cellular stress elicits IFN-I response and inhibits neurogenic differentiation potential of neural stem cells.

