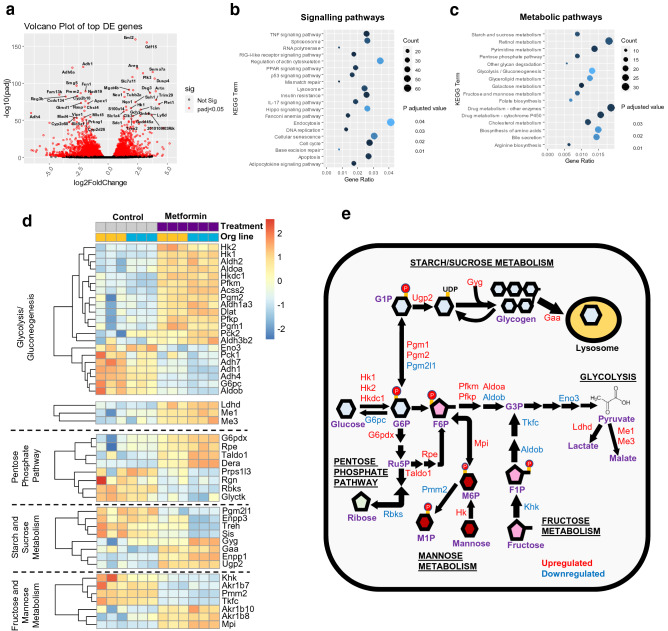
Figure 1.
The effects of metformin on differentially expressed (DE) genes and metabolic pathways in mouse intestinal monolayer cultures. (a) Volcano plot displaying gene expression changes in duodenal organoid cells in 2D monolayer cultures treated with 1 mM metformin or no treatment control (n = 6 plates per condition from 2 different organoid lines). Fold-change (X-axis) compared to p-adjusted values (Y-axis) of individual genes altered by metformin treatment. Red dots represent DE genes (P < 0.05); black dots represent gene expression changes that were not statistically significant (Not Sig). Labelled genes represent the top 50 DE genes (sorted by P values). Analysis was performed using Bioconductor software packages in RStudio (v.1.2.5019), with gene annotation from the Ensembl dataset in BioMart (v2.40.5). Volcano plots were generated using the Geompoint function of the ggplot package. (b,c) KEGG enrichment analysis for changes in signalling (b) and metabolic (c) pathways affected by metformin treatment. Gene ratio is the number of DE genes in a KEGG pathway divided by total number of genes in the pathway. Count represents the numbers of DE genes. KEGG pathway analysis was performed using clusterprofiler. (d) Heatmaps showing DE genes (filtered by p-adjusted value < 0.05) involved in hexose metabolism. Relative expression is normalised to z-scores for each gene. Each box indicates a separate plate and the corresponding organoid line. Heatmaps were plotted using Pheatmap. (e) Schematic showing expression changes of genes involved in all hexose metabolism pathways. Red and blue show upregulated and downregulated genes, respectively.

