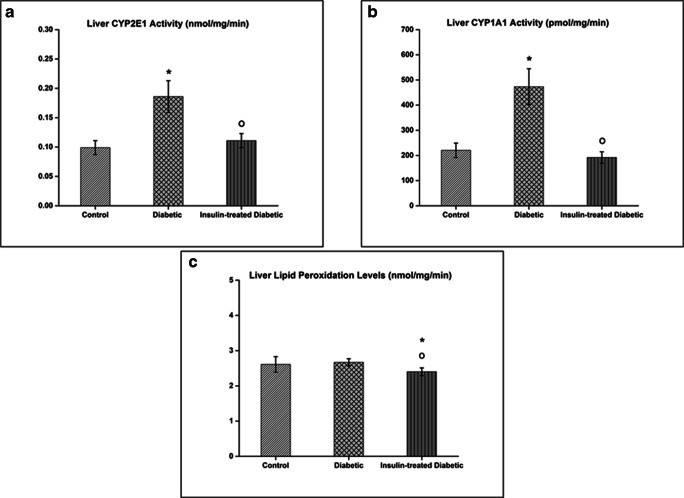
Fig. 2.
Hepatic CYP2E1 (a) and CYP1A1 (b) activities and lipid peroxidation (c) levels in the controls and treatment groups of Sprague Dawley rats. Results are presented as means ± SD; n = 05 for the control group, n = 11 for the diabetic rats, and n = 11 for the diabetic rats treated with insulin. Significant changes are expressed as *(p < 0.05) in comparison with the control group; O (p < 0.05) in comparison with the diabetic group

