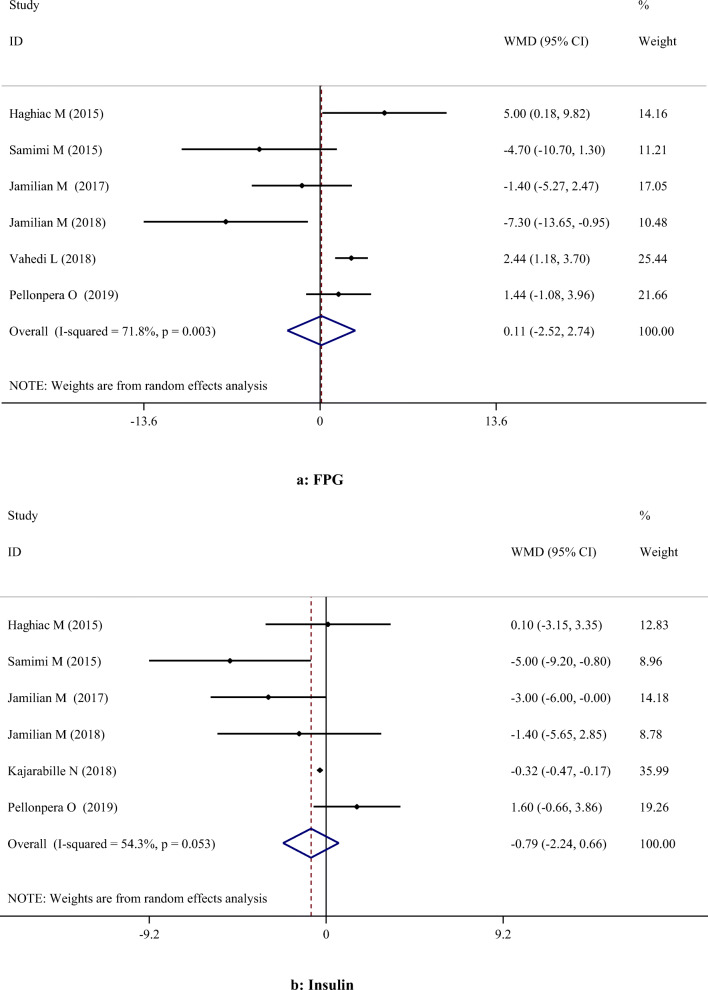
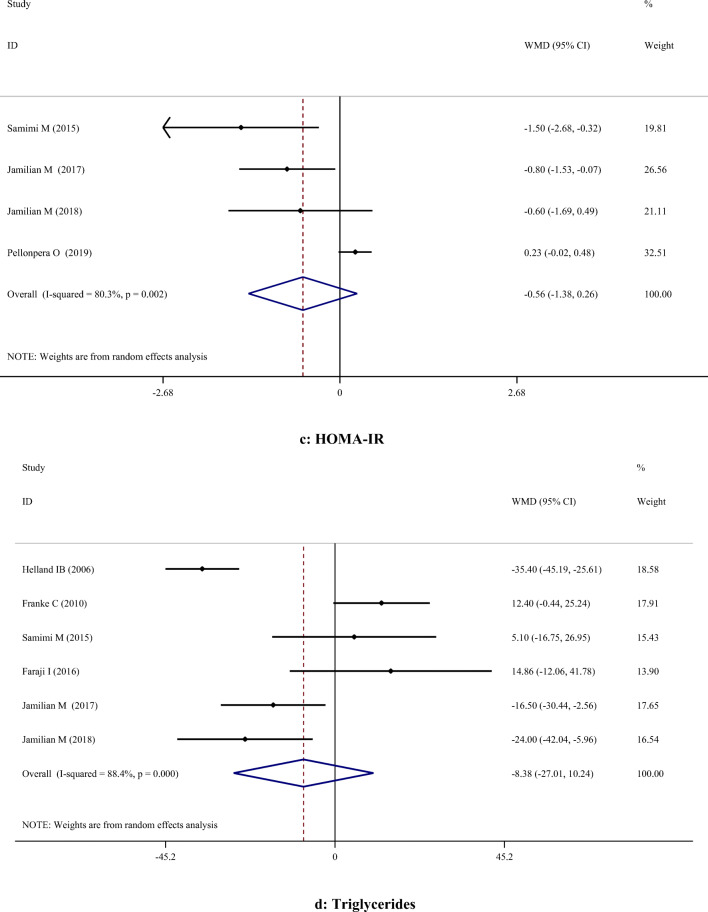
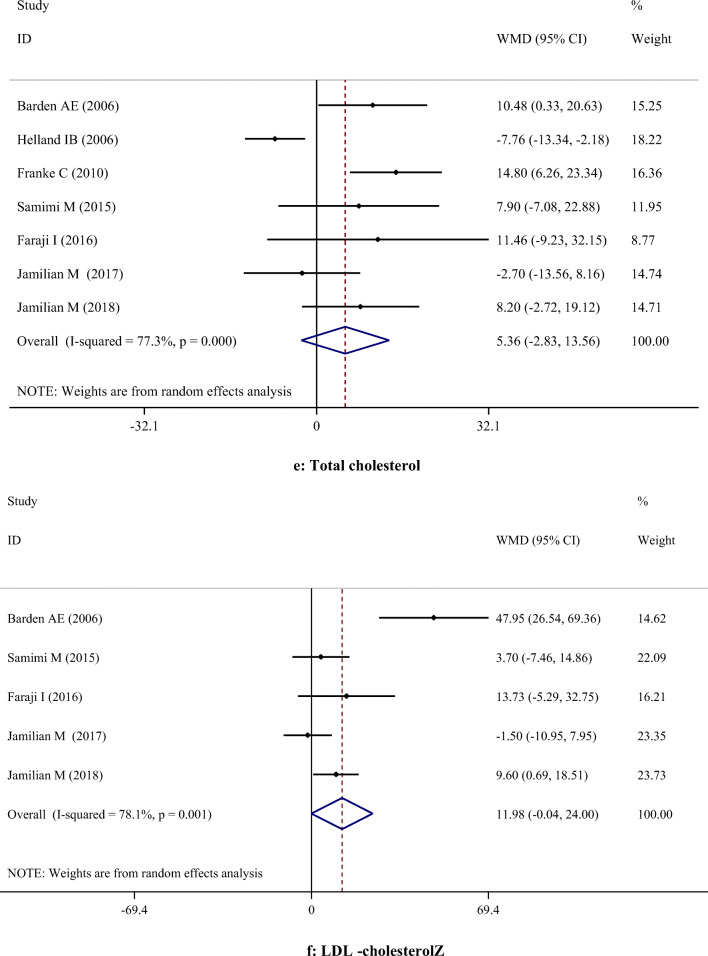
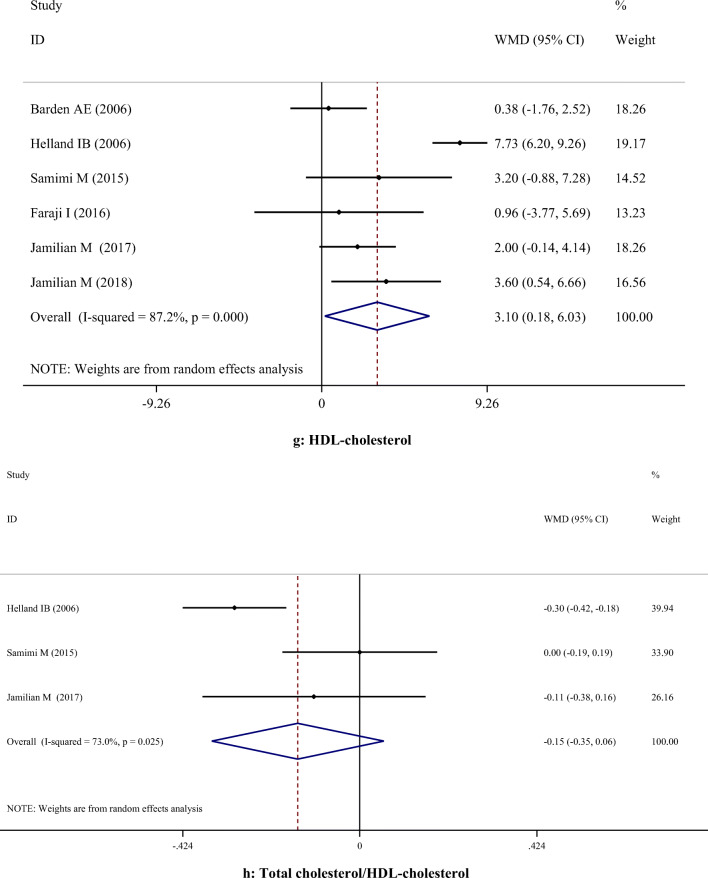
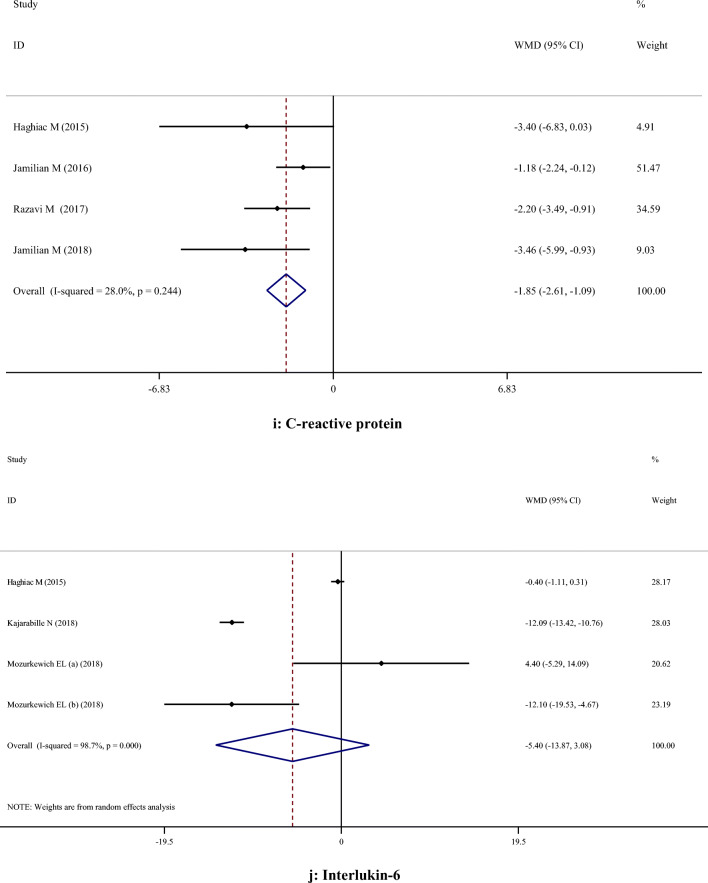
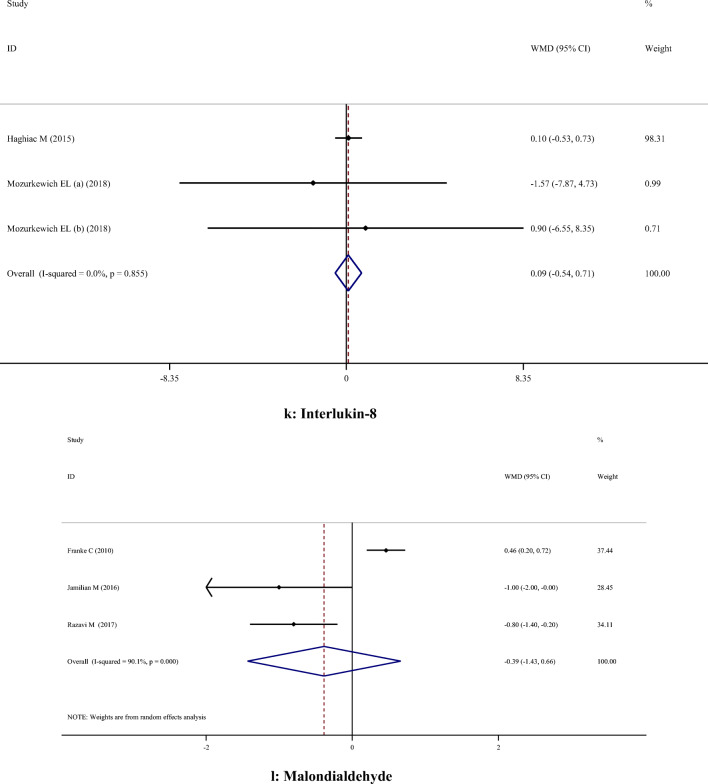
Fig. 2.
A-H. Meta-analysis metabolic profiles weighted mean difference estimates for A) FPG, B) Insulin, C) HOMA-IR, D) Triglycerides, E) Total cholesterol, F) LDL-cholesterol, G) HDL-cholesterol, H) Total cholesterol/HDL-cholesterol, I) C-reactive protein, J) Interleukin-6, K) Interlukin-8, I) Malondialdehyde in the omega-3 and placebo groups (CI = 95%)

