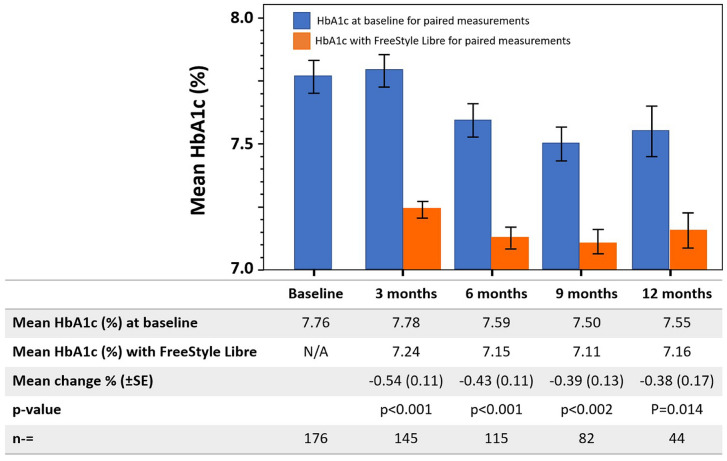
Fig. 2.
Mean HbA1c levels for 176 patients with type 2 diabetes at 3-monthly intervals, following initiation of the FreeStyle Libre flash glucose monitoring system. Each time point contains the data for the cohort of study subjects with both a baseline and an intervention HbA1c reading for that time point. All subjects (n = 176) had a baseline HbA1c, but not all subjects provided HbA1c data for all time points thereafter. The data shown in the table is the mean baseline and HbA1c at each time point, and the mean change in HbA1c. Data are shown as mean HbA1c (%) ± standard error (SE). Patients experienced a statistically significant reduction in HbA1c levels from baseline, which was sustained over 12 months. Differences in mean HbA1c were not significant between 3 and 12 months

