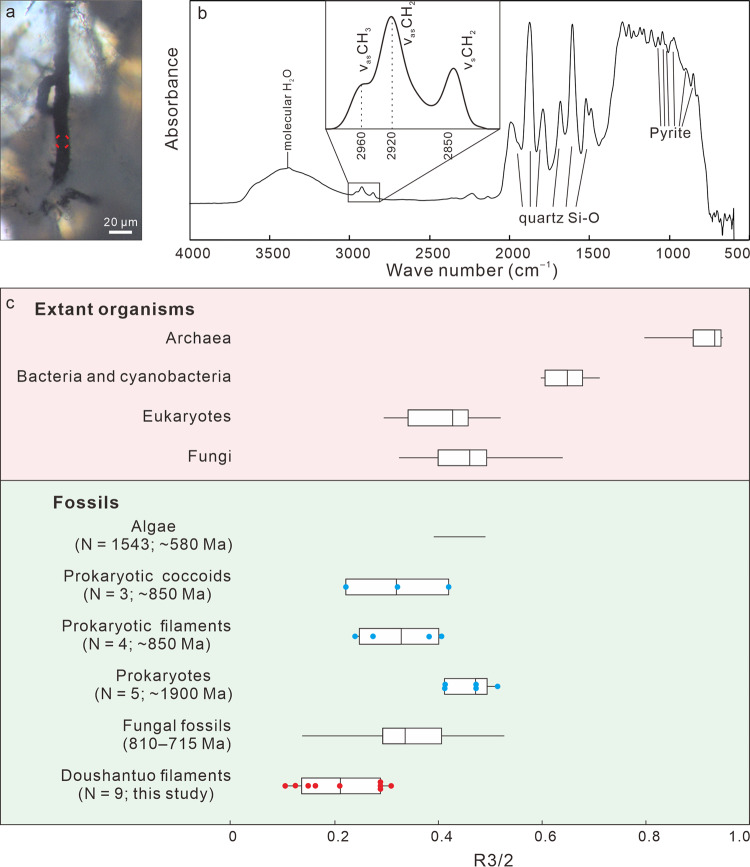
Fig. 6. FTIR of Type A filament from Beidoushan.
a TLM photomicrograph of Type A filament, with red circle denoting spot of FTIR analysis shown in b. b FTIR spectrum, with enlargement of 2800–3000 cm–1 spectral region (inset). Bands at 2960 cm–1, 2920 cm–1, and 2850 cm–1 are due to asymmetric aliphatic CH3 (end-methyl), asymmetric, and symmetric aliphatic CH2 (methylene-chain), respectively10,11. Relative intensities of 2960 cm–1 and 2920 cm–1 bands were used to calculate R3/2 ratios that reflect ratios of -CH3 to -CH2 groups11. Band at ~3400 cm–1 is due to molecular water10; bands at 1992, 1875, 1792, 1683, 1608, 1522, and 1490 cm–1 are due to Si–O bonds of quartz81; bands at 1071, 1045, 1024, 974, 852, and 826 cm–1 are probably due to pyrite82. c, Box-and-whisker plot of R3/2 ratios of representative modern organisms and fossils. Plots for extant archaea, prokaryotes, eukaryotes, and fungi, as well as 810–715 Ma fungal fossils are from ref. 11 and references therein. Data for fossil algae (N = 1543 spot analyses in three specimens) are from ref. 83. Data for fossil prokaryotic coccoids (blue dots; N = 3 specimens), prokaryotic filaments (blue dots; N = 4 specimens), and prokaryotes (blue dots; N = 5 specimens) are measured from fig. 5a of ref. 81 using ImageJ 1.47 v. Data for Doushantuo filaments (red dots; N = 9 spot analyses in two filaments) are based on analyses of sample 18BD-25 from Beidoushan. Box-and-whisker plots show the median (central line), the minimum and maximum (whiskers), and the 25th–75th percentile (bounds of the box), whereas horizontal line for fossil algae show the minimum and maximum. Source data are provided as a Source Data file.

