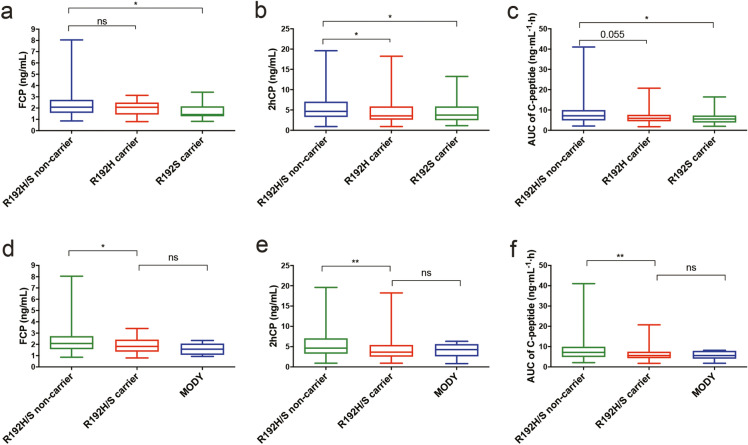
Fig. 2.
Serum C-peptide levels among the diabetic patients with different phenotypes of PAX4. FCP levels (a), 2hCP levels (b) and AUC of C-peptide levels (c) of R192S/H non-carriers, R192H carriers and R192S carriers; FCP levels (d), 2hCP levels (e) and AUC of C-peptide levels (f) of R192S/H non-carriers, R192H/S carriers and MODY patients. FCP fasting C-peptide, 2hCP 2 h postprandial C-peptide, AUC area under curve, MODY maturity-onset diabetes of the young, ns no significance. Mann-Whitney U test was used for the data analysis. Data are expressed with box and whiskers (minimum to maximum). *P < 0.05; **P < 0.01; ***P < 0.001

