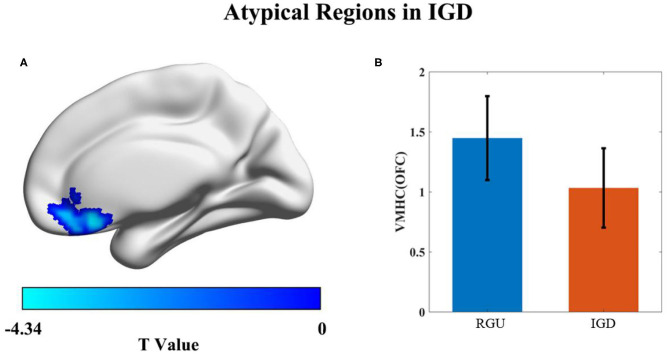
Figure 2.
Differences in VMHC value between the IGD and RGU groups durinresting state. p < 0.05 (AlphaSim correction). Voxel size = 3 × 3 × 3 mm3, the blue color represents the VMHC decreased area in the IGD group compared with the RGU group (A). Histogram (B) shows the mean and standard deviation of VMHC values in the two groups.

