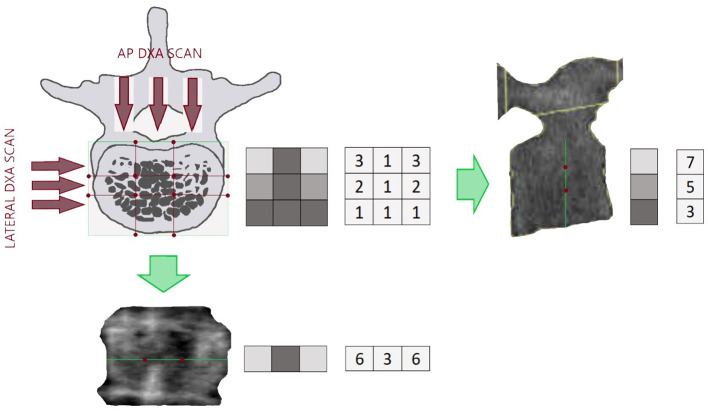
Figure 1.
Example of a section of a lumbar vertebra with the relating lateral DXA scan (right) and the Antero Posterior (AP) DXA scan (bottom). The green lines on the DXA images represent the projection of the lumbar section in the X-ray direction. Red points are reference points that separate areas with different density. On the right side of each picture there is a representation of BMD distribution in the investigated section and the resulting lines, being the lines the projection of the lumbar section. Density distribution is shown in a grayscale form and numerical form, to better understand how high density (light gray colored squared) and porosity (dark gray colored squared) affect the resulting images.

