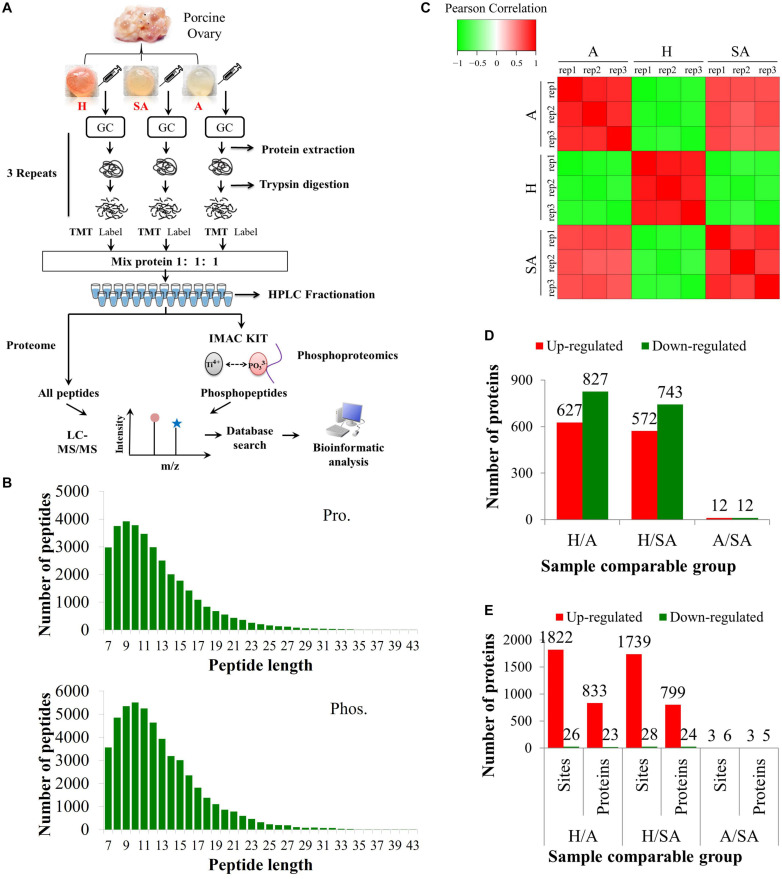
FIGURE 1.
Overview of proteomic and phosphoproteomic analyses in granulosa cells obtained from ovaries with different follicular statuses. (A) Proteomic and phosphoproteomic analyses workflow in granulosa cells from healthy (H), slightly atretic (SA), and atretic (A) porcine follicle samples. (B) The distributions of raw MS/MS length of peptides and phosphopeptides quantified from proteomic and phosphoproteomic data, respectively. (C) Reproducibility analysis of the samples. (D) The amounts of DEPs in different comparable groups. (E) The amounts of the differentially quantified phosphosites and phosphoproteins in different comparable groups.

