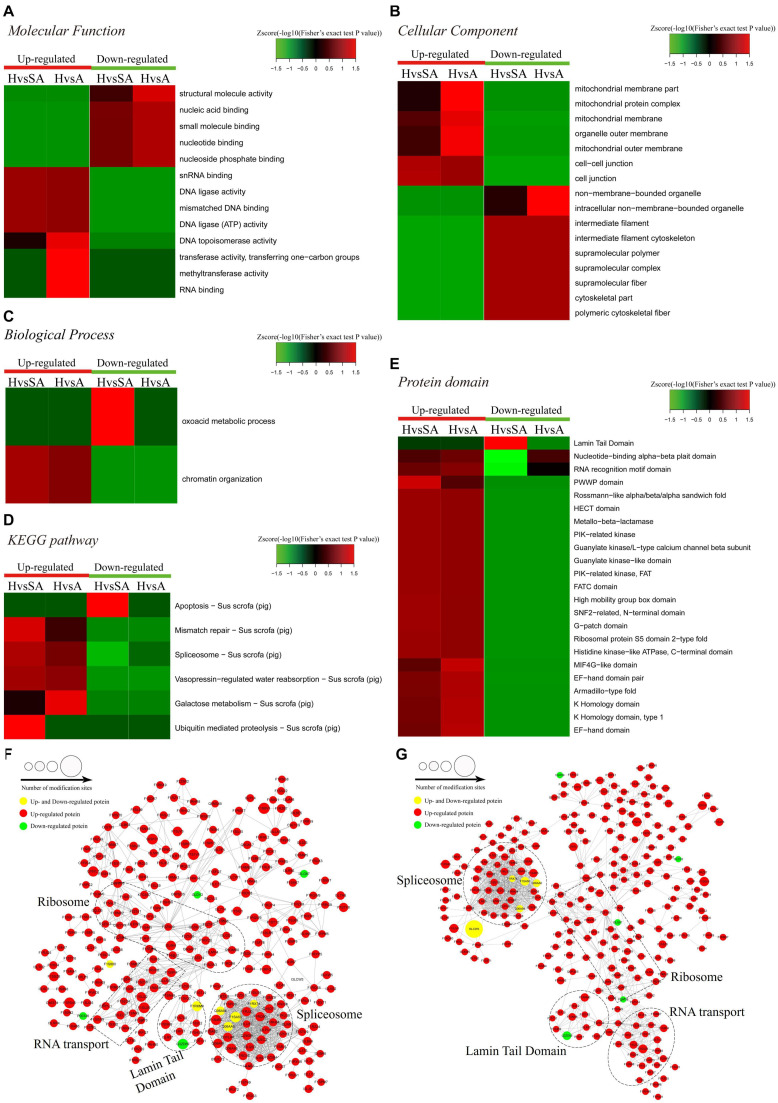
FIGURE 4.
Heat map obtained from functional enrichment-based cluster analysis of quantified phosphoproteome during follicular atresia and protein–protein interaction networks of DEPs. (A–C) Heat maps obtained from GO enrichment-based cluster analysis. (D,E) Heat map obtained from enrichment-based cluster analysis of protein domains and KEGG pathways. Analyses of the protein–protein interaction networks for differentially expressed phosphorylated proteins between H and SA (F) and between H and A (G). H, healthy follicle; SA, slightly atretic follicle; A, atretic follicle.

