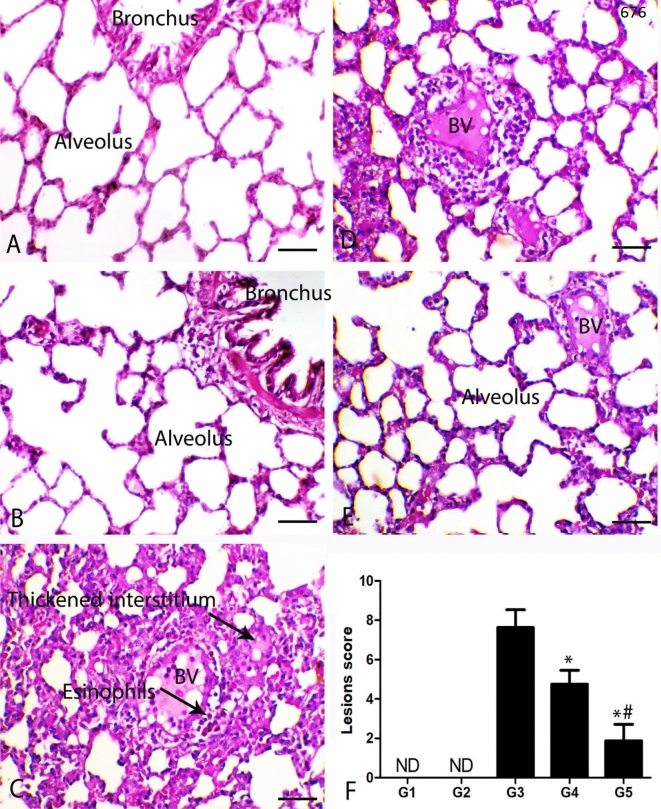
Figure 2.
Photomicrograph of the pulmonary sections of the different groups. (A) The lung of G1 and (B) lung of G2 showing normal alveoli and bronchi. (C) Lung of G3 showing interstitial pneumonia associated with perivascular inflammatory cells infiltration mostly eosinophils, BV indicates blood vessels revealing damage of its wall. (D) Lung of G4 showing decrease both pneumonia and perivascular inflammatory cells infiltration. (E) Lung of G5 showing thin alveolar septa and with marked increase the alveolar spaces. H&E stain bar = 50 µm. (F) Quantitative lesion score showing marked decrease the pulmonary lesions, * indicates significe in comparing with G3 (P < 0.005) and # indicates significance in comparing with G4 (P < 0.005).

