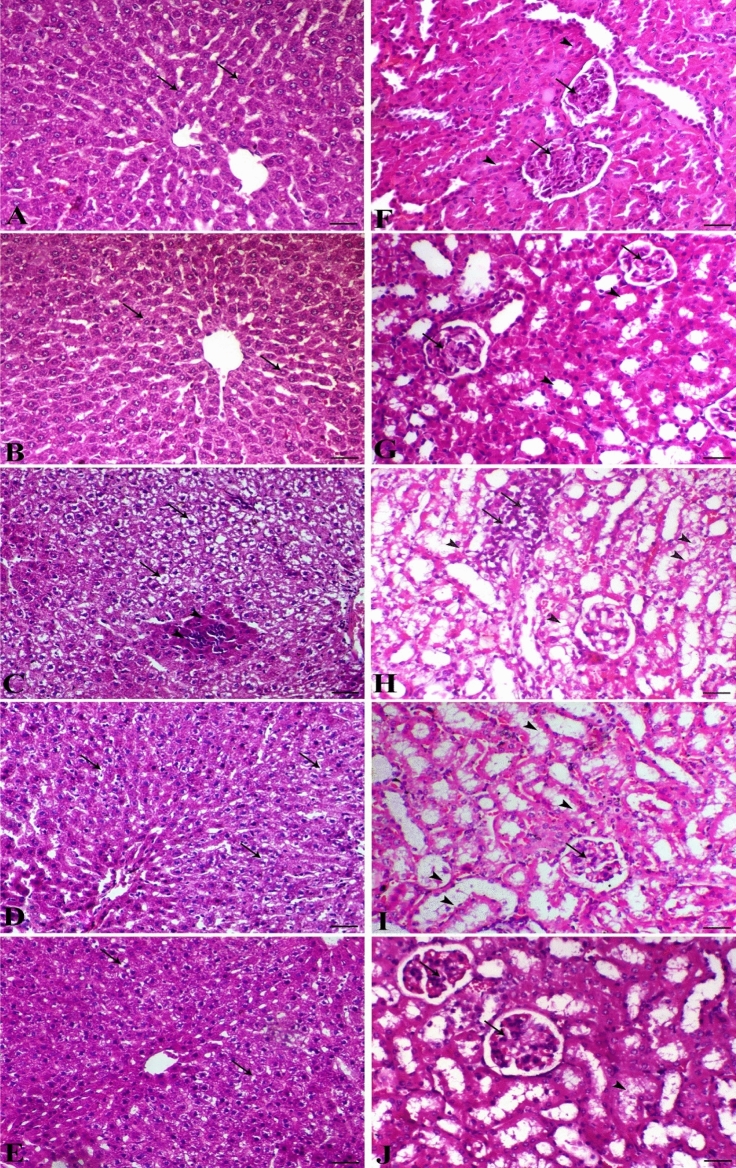
Figure 3.
Hepatic (A–E) and renal sections (F–J) of different treated groups. (A) Liver of control group (arrows indicate normal hepatocytes); (B) liver of thymoquinone group (arrows indicate normal hepatocytes); (C) liver of malathion group (arrows indicate severe hepatic vacuolation and arrowheads indicate focal area of coagulative necrosis); (D) liver of malathion + thymoquinone (25 mg/kg) (arrows indicate marked decrease of hepatic vacuolation); (E) liver of malathion + thymoquinone (50 mg/kg) (arrows indicate marked decrease of hepatic vacuolation), H&E, bar = 50 µm. (F) Kidney of control group (arrows indicate normal glomeruli and arrowheads show normal renal tubules); (G) kidney of thymoquinone group (arrows indicate normal glomeruli and arrowheads show normal renal tubules); (H) kidney of malathion group (arrows indicate focal interstitial lymphocytic infiltration and arrowheads indicate marked renal tubular epithelium vacuolation); (I) kidney of malathion + thymoquinone 25 mg/kg (arrows indicate marked decrease of renal degeneration); (J) kidney of malathion + thymoquinone (50 mg/kg) (arrowheads indicate marked decrease of renal tubular epithelium vacuolation and arrow shows normal glomerulus), H&E, bar = 50 µm.

