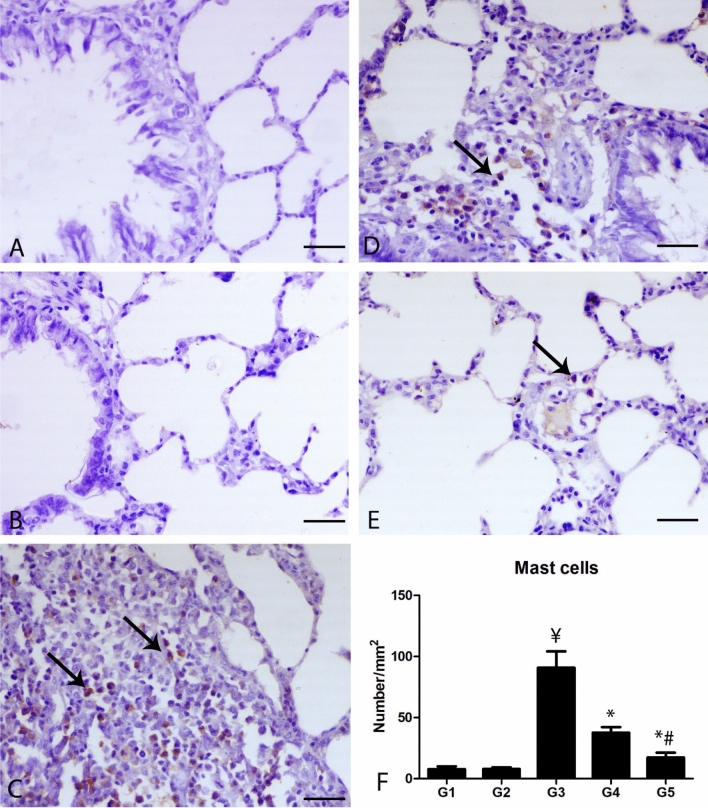
Figure 4.
Photomicrograph of the pulmonary sections of the different groups immunostained with C-KIT antibody. (A) The lung of G1 and (B) lung of G2 showing scarcely expression of C-KIT antibody within the pulmonary tissues. (C) Lung of G3 showing numerous C-KIT positive mast cells (arrows). (D) Lung of G4 showing decrease of C-KIT positive mast cells. (E) Lung of G5 showing marked decrease C-KIT positive mast cells, bar = 50 µm. (F) Quantitative score of the number of C-KIT positive mast cells. ¥ indicates significance in comparing with G1 (P < 0.001), * indicates significance in comparison with G3 (P < 0.001) and # indicates significance in comparison with G4 (P < 0.05).

