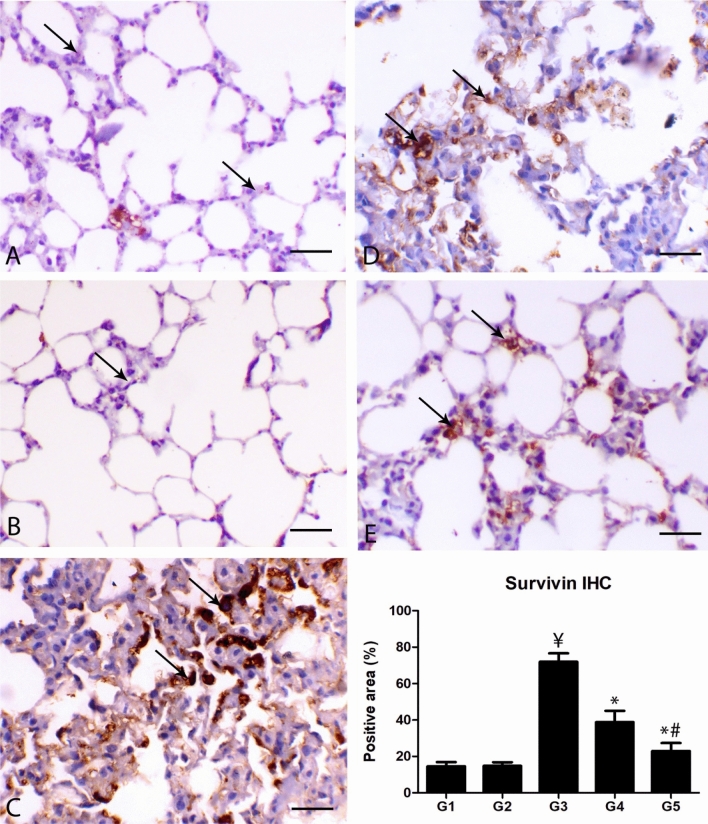
Figure 5.
Photomicrograph of the pulmonary sections of the different groups immunostained with surviving antibody. (A) The lung of G1 and (B) lung of G2 showing mild expression of surviving within the alveolar cells. Normal alveoli and bronchi. (C) Lung of G3 showing marked expression within the proliferated alveolar cells mostly alveolar type II. (D) Lung of G4 showing decrease of survivin expression within the alveolar cells. (E) Lung of G5 showing marked decrease of survivin expression within the alveolar cells, bar = 50 µm. (F) Quantitative score of the percent of positive areas showing survivin expression. ¥ indicates significance in comparing with G1 (P < 0.005), * indicates significance in comparison with G3 (P < 0.005) and # indicates significance in comparison with G4 (P < 0.005).

