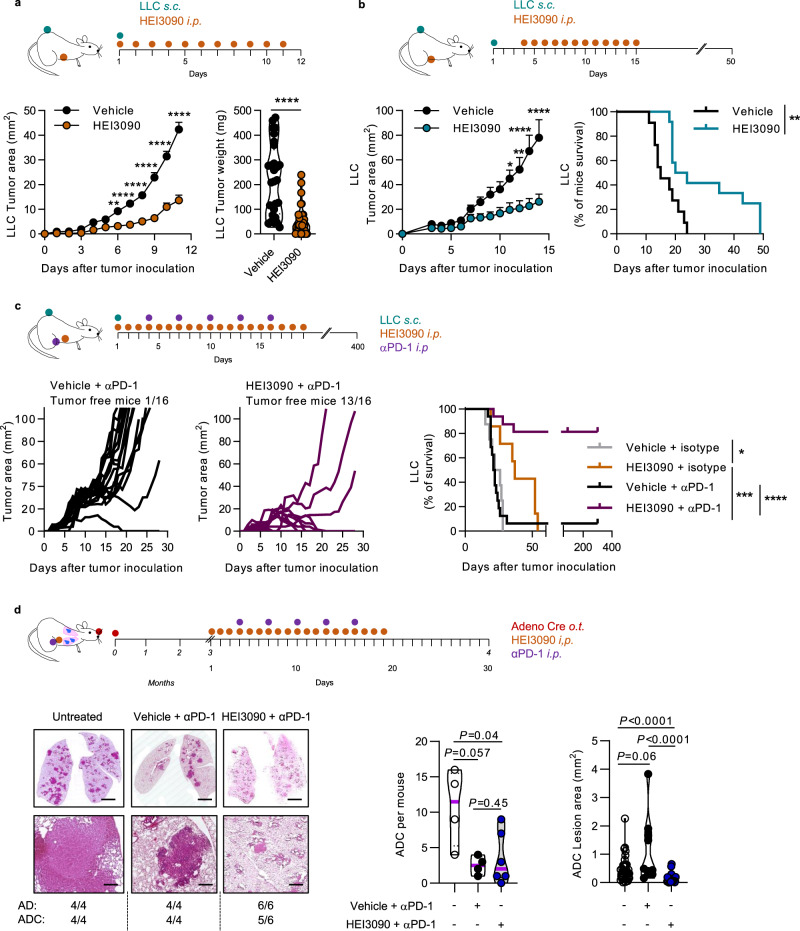
Fig. 2. HEI3090 inhibits tumor growth and combined with immunotherapy ameliorates mice survival.
a Prophylactic administration. Average tumor area and weight of LLC allograft after daily treatment with HEI3090. Curves showed mean tumor area in mm2 ± SEM (vehicle n = 28, HEI3090 n = 32, two-way Anova test, left panel) and graph showed tumor weight the day of sacrifice. Data are presented by violin plots showing all points with hatched bar corresponding to median tumor weight (vehicle n = 28, HEI3090 n = 32. Two-tailed Mann–Whitney test, right panel). b Therapeutic administration. Average tumor area and survival curves of LLC allograft. HEI3090 started when tumors reached 10–15 mm2 of size. Curves showed mean tumor area in mm2 ± SEM (n = 12, two-way Anova test, left panel and Mantel Cox test, right panel). c Combo treatment. Average tumor area of LLC allograft after HEI3090 and αPD-1 treatment. Spaghetti plots and survival curves of animals are shown (n = 16, Mantel Cox test). d Schematic illustration of treatment given to LSL-KrasG12D mice. Representative images showing lung tumor burden (Bar = 2 mm upper panel and 500 µm lower panel) with tumor histopathology (n = 4). Average tumor burden of LSL-KrasG12D mice in response to treatments were studied as the number of ADC per mouse (untreated, n = 4, vehicle + αPD-1, n = 4, HEI3090 + αPD-1, n = 6; two-tailed Mann–Whitney test) and the surface of ADC lesions per lung. Each point represents one lesion, all lesions are shown to illustrate the heterogeneity (untreated and vehicle + αPD-1, n = 4 mice, HEI3090 + αPD-1, n = 6, Two-tailed Mann–Whitney test). p values: *p < 0.05, **p < 0.01 ***p < 0.001, ****p < 0.0001. Source data are provided as a Source Data file. AD adenoma, ADC adenocarcinoma.

