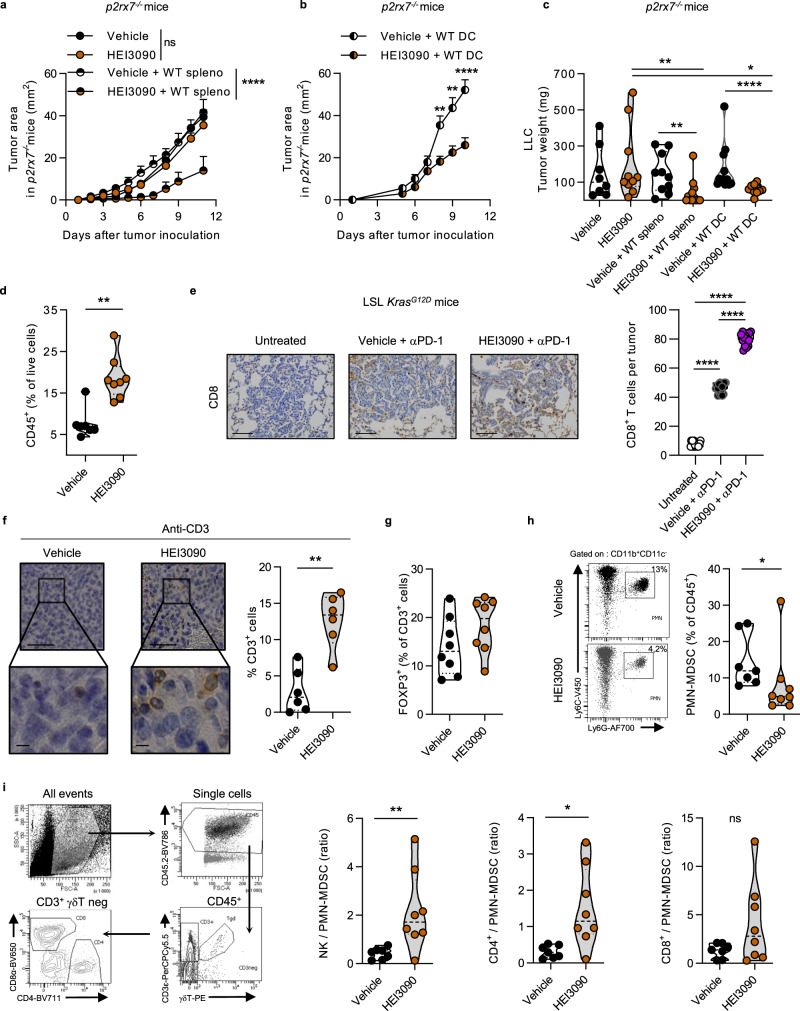
Fig. 3. Immune cells mediate the antitumor activity induced by HEI3090.
a Average tumor area of LLC allograft in p2rx7-deficient mice (p2rx7−/−) after daily treatment with HEI3090 or after adoptive transfer of WT splenocytes and daily treatment with HEI3090. Curves showed mean tumor area in mm2 ± SEM (vehicle n = 13, HEI3090 n = 16 mice, vehicle + WT spleno n = 11, HEI3090 + WT spleno: n = 12, two-way Anova test). b Average tumor area of LLC allograft in p2rx7-deficient mice (p2rx7−/−) after adoptive transfer of WT DCs and daily treatment with HEI3090. Curves showed mean tumor area in mm2 ± SEM (n = 8, two-way Anova test). c Tumor weight of animals from the study shown in a and b. Data are presented by violin plots showing all points with hatched bar corresponding to median tumor weight (vehicle n = 8, HEI3090 n = 10 mice, vehicle + WT spleno n = 10, HEI3090 + WT spleno n = 12, vehicle + WT DC n = 13, HEI3090 + WT DC n = 12 mice, two-tailed Mann–Whitney test). d Characterization of immune infiltrate at day 12. Percentage of CD45+ analyzed by flow cytometry among living cells within TME. Data are presented by violin plots showing all points with hatched bar corresponding to median tumor weight (vehicle n = 7, HEI3090 n = 8, two-tailed Mann–Whitney test). e Representative picture of CD8+ cells recruitment in LSL-KrasG12D mice over six mice studied (bar = 100 µm) and quantification. Data are presented by violin plots showing all points with hatched bar corresponding to median CD8+ T cells (four tumors per mouse, n = 4 mice per group, two-tailed Mann–Whitney test). f Representative images of CD3 staining in LLC tumors over six mice studied (bar = 100-µm upper panel and 50-µm lower panel) and quantification data are presented by violin plots showing all points with hatched bar corresponding to median CD8+ T cells (n = 6 per group, two-tailed Mann–Whitney test). g Percentage of regulatory T cells determined by flow cytometry as FOXP3+ CD4+ among CD3+ within LLC tumors. Data are presented by violin plots showing all points with hatched bar corresponding to median FOXP3+ cells of CD3 cells (n = 8 per group, two-tailed Mann–Whitney test). Gating strategy is presented in Supplementary Fig. 12. h Proportion of PMN-MDSC among CD45+ within LLC tumors. Data are presented by violin plots showing all points with hatched bar corresponding to median PMN-MDSC cells among CD45+ cells (n = 7, per group. Two-tailed Mann–Whitney test). Full gating strategy is presented in Supplementary Fig. 12. i Gating strategy (left panel) and ratio of NK, CD4+, or CD8+ T cells on PMN-MDSC within LLC tumors (right panel). Data are presented by violin plots showing all points with hatched bar corresponding to median of indicated cells (n = 8 per group, Two-tailed Mann–Whitney test). p values: *p < 0.05, **p < 0.01, ****p < 0.0001. Source data are provided as a Source Data file. Spleno Splenocytes, DC dendritic cells, PMN-MDSC poly morpho nuclear-myeloid-derived suppressor cells.

