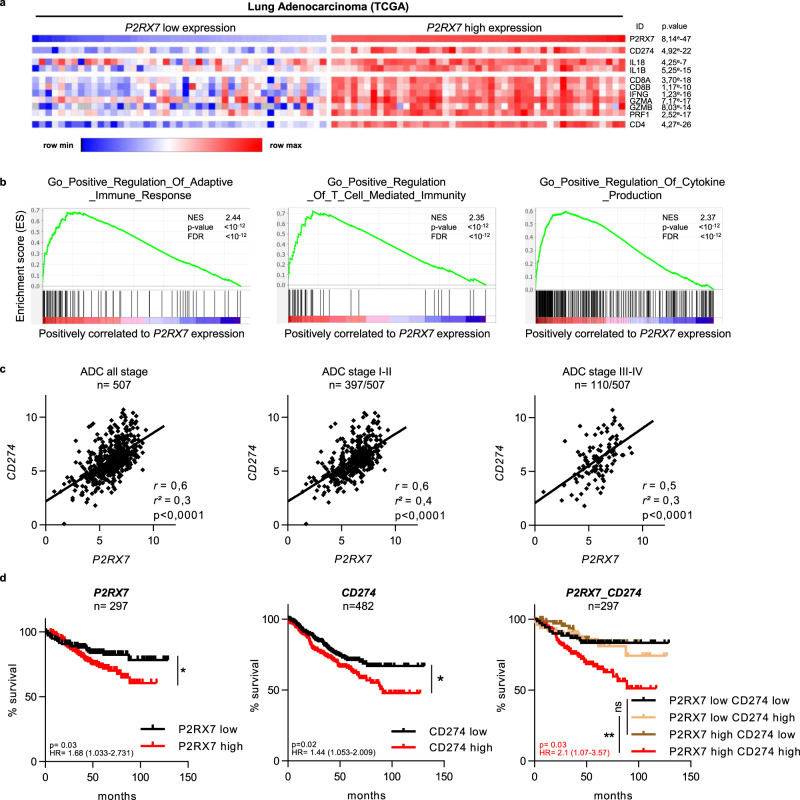
Fig. 7. P2RX7 expression in LUAD is associated with “hot” immunophenotype signature.
a Association of P2RX7 mRNA expression with a cluster of inflammatory genes (heatmap). Expression values are represented as colors, where the range of colors (red, pink, light blue, dark blue) shows the range of expression values (high, moderate, low, lowest). Raw p values (Linear models for microarray analysis, Limma) are shown. b Gene set enrichment analysis (GSEA) plot associating P2RX7 high mRNA levels from LUAD patients (TCGA) with three inflammatory signatures. The enrichment score is shown as a green line, and the vertical black bars below the plot indicate the positions of specific inflammatory signature-associated genes, which are mostly grouped in the fraction of upregulated genes. For each signature, normalized enriched score (NES), p values (bilateral Kolmogorov–Smirnov), and false discovery rate (FDR) are shown. c. Correlation curves of P2RX7 and CD274 expression from LUAD patients (TCGA) of all stage (left panel), low stage (middle panel), and high stage (right panel). r, r2, and p values are shown in each panel, (Person correlation and t test). d Kaplan–Meyer plot (http://kmplot.com) showing survival curves of P2RX7 high vs. P2RX7 low patients (left panel), CD274 high vs. CD274 low (middle panel), and P2RX7 high or low vs. CD274 high or low (right panel). For all panels, the optimal cutoff is determined on KMplot. The p value (log-rank, Mantel Cox test), the hazard ratio, and number of patients are indicated. Source data are provided as a Source Data file. ADC adenocarcinoma, HR hazard ratio.

