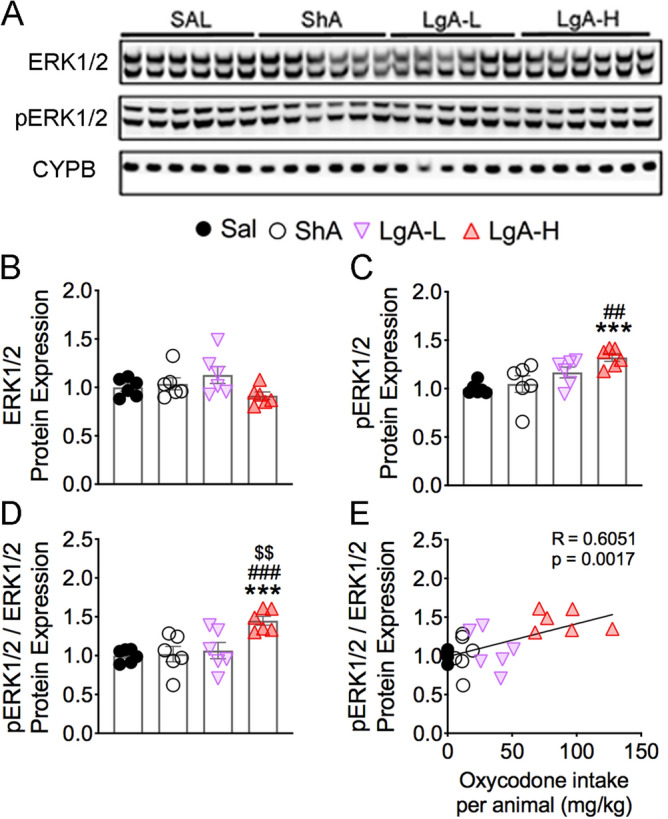
Figure 2.

Effects of oxycodone SA on ERK1/2 phosphorylation. (A) Images of western blot and (B, C) quantification of ERK1/2, and pERK1/2. (B) ERK1/2 protein levels were not significantly impacted by oxycodone. (C) pERK1/2 abundance was increased in only LgA-H rats. (D) pERK1/2/ERK1/2 ratios are substantially increased in the LgA-H rats. (E) pERK1/2/ERK1/2 ratios correlate with amount of oxycodone taken. (n = 6 Sal; n = 6 ShA; n = 6 LgA-L; n = 6 LgA-H). Full-length blots are presented in Supplementary Fig. S5. Key to statistics: *** = p < 0.001 in comparison to Sal rats; ##, ### = p < 0.01, 0.001, respectively, in comparison to ShA rats; $$ = p < 0.01, in comparison to LgA-L rats. Statistical analyses are as described in Fig. 2.
