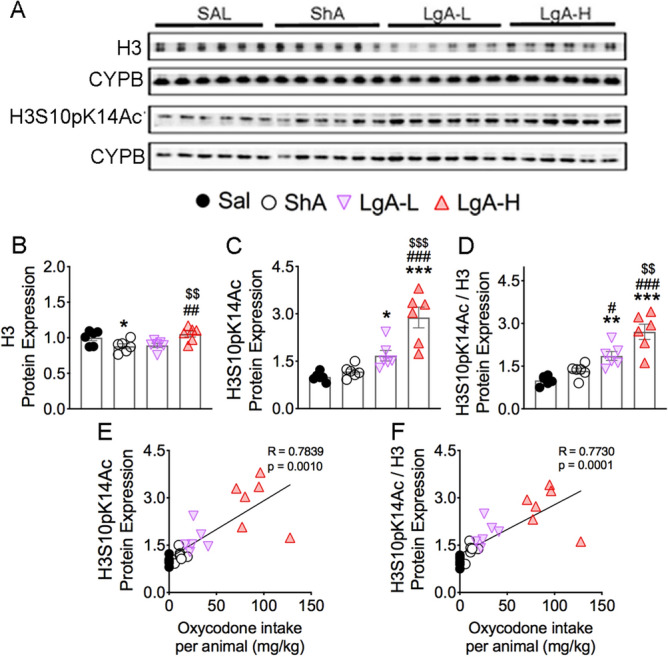
Figure 5.

Effects of oxycodone SA and early withdrawal on histone H3 and H3S10pK14Ac. (A) Images of western blot and quantification of (B) histone H3 and (C) H3S10pK14Ac protein levels. (B) Protein levels of histone H3 display decrease in the ShA group. (C) Protein expression of H3S10pK14Ac shows significant increases in LgA-L and LgA-H groups. (D) Ratio of H3S10pK14Ac/H3 displays significant increases in the LgA-L and LgA-H groups. (E) Protein expression of H3S10pK14Ac and (F) H3S10pK14Ac/H3 positively correlated with doses of oxycodone taken during the experiment (n = 5–6 Sal; n = 6 ShA; n = 6 LgA-L; n = 6 LgA-H). Key to statistics: *, **, *** = p < 0.05, 0.01, 0.001, respectively, in comparison to Sal rats; #, ##, ### = p < 0.05, 0.01, 0.001, respectively, in comparison to SHA rats; $$, $$$ = p < 0.01, 0.001 in comparison to LgA-L rats. Statistical analyses are as described in Fig. 2.
