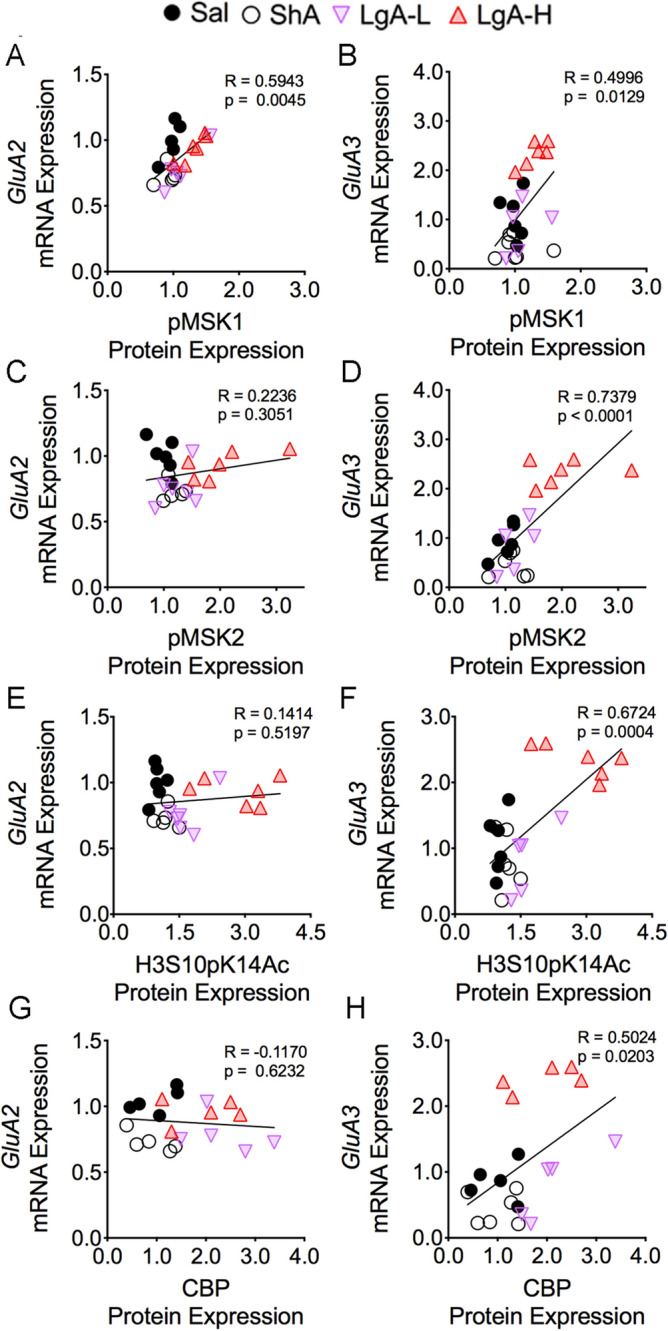
Figure 8.

GluA3 mRNA correlated with pMSK1, pMSK2, H3S10pK14Ac, and CBP protein expression. The mRNA expression of GluA2 shows significant linear relationship with (A) pMSK1, but not with (C) pMSK2, (E) H3S10pK14Ac, and (G) CBP protein expression. However, the mRNA levels of GluA3 display a positive correlation with the protein abundance of (B) pMSK1, (D) pMSK2, (F) H3S10pK14Ac, and (H) CBP (n = 5–6 Sal; n = 5–6 ShA; n = 5–6 LgA-L; n = 5–6 LgA-H). The correlation coefficients and p values are shown on the graph.
