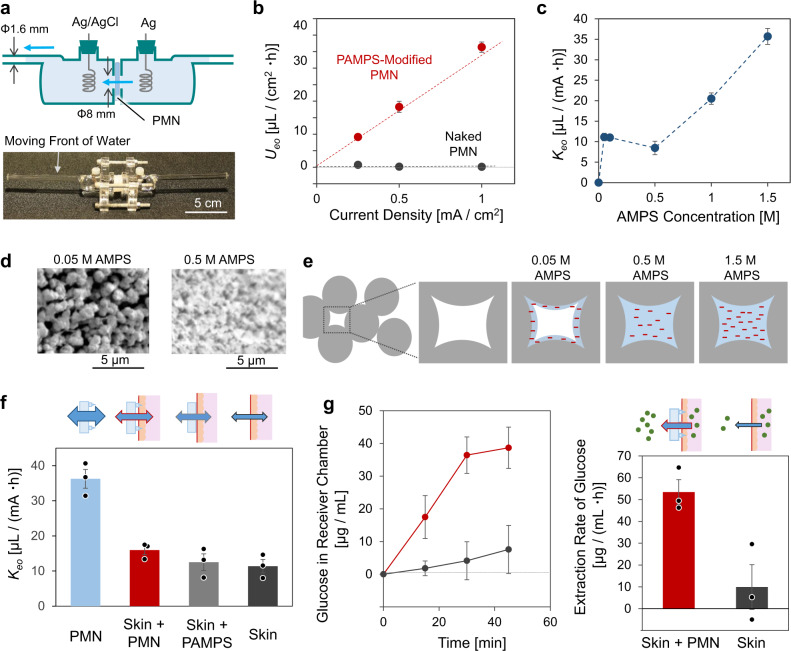
Fig. 3. Transport of water and small molecules.
a A side-by-side Franz cell for measurement of the flux of water transport through a PMN under DC current application. b The flow velocity of EOF as a function of current density applied for a naked PMN (black) and a PAMPS-filled PMN prepared from 1.5 M AMPS (red) (N = 3 independent experiments; mean ± SD). c The plot of (slope of vs. current density) against the AMPS concentration used for the modification of PAMPS (N = 3 independent experiments; mean ± SD). d Representative SEM images of cross sections of PMNs modified with PAMPS made from 0.05 and 0.5 M AMPS (N = 3 independent experiments). e Schematic illustration of pores in the PMN modified with PAMPS from various concentrations of AMPS. f The EOF strength through a PAMPS-filled PMN made from 1.5 M AMPS (blue), a pig skin with the PMN (red), a pig skin with the PAMPS-filled porous PGMA plate (gray bar) and an intact skin (black) (N = 3 independent experiments; mean ± SD). g The time-course of glucose concentration in receiver chamber (plot) and the rate of extraction of glucose (bar) from the intact skin (black) and the skin with the PAMPS-filled PMN (red) (N = 3 independent experiments; mean ± SD). pH 7 McIlvaine buffer was used.

