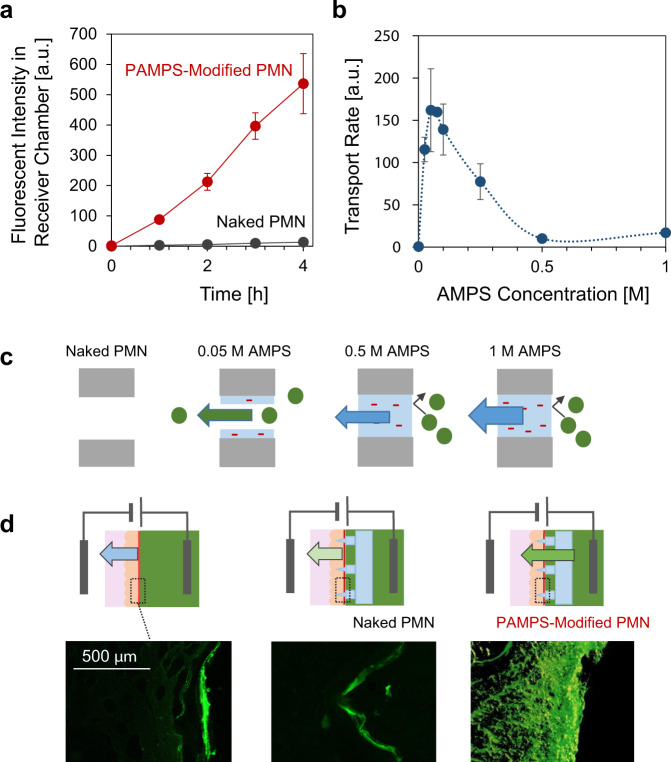
Fig. 4. Transport of large molecules.
a The time-course of fluorescent intensity of FITC-dextran transported to the receiver chamber through the naked PMN (black) and the PAMPS-modified PMN (red) at 3 mA/cm2 (N = 3 independent experiments; mean ± SD). b The transport rate of FITC-dextran at 3 mA/cm2 as a function of AMPS concentration for modification of PAMPS (N = 3 independent experiments; mean ± SD). c Schematic illustration of the sieving effect of the pore-filling PAMPS for larger molecules. d Cross-sectional fluorescence images of pig skins after the transdermal application of 0.5 mA/cm2 for 30 min without a PMN (left), with a naked PMN (center) and with a PAMPS-modified PMN (0.05 M AMPS) (right) (N = 3 independent experiments for each sample).

