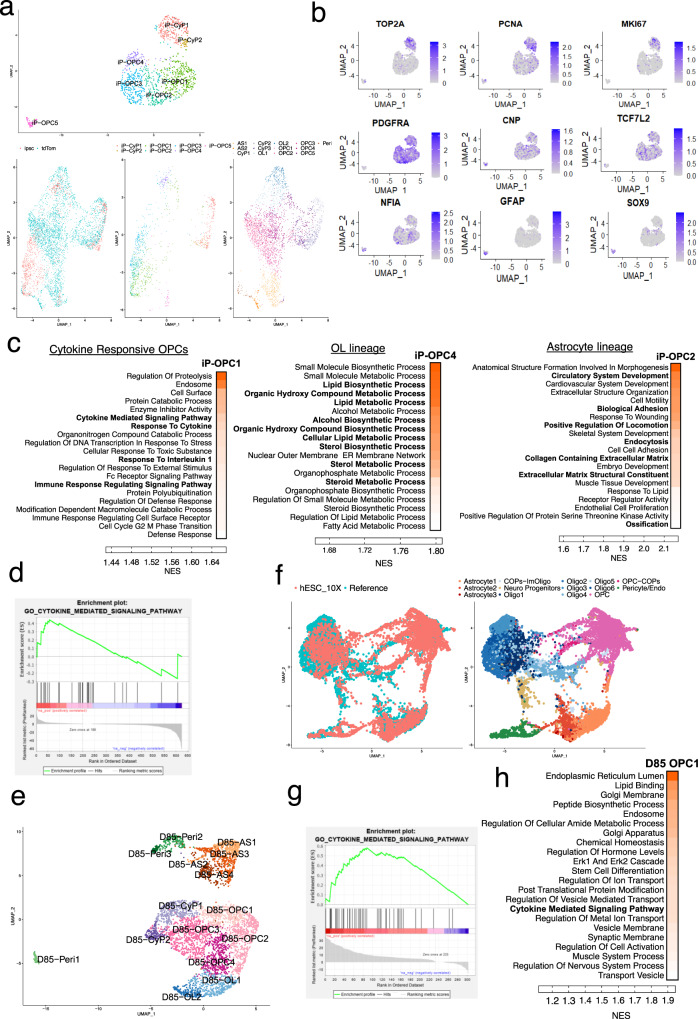
Fig. 6. Single-cell transcriptomics and Go term analysis of hiPSC-derived PDGFRα+ OPCs and an independent batch of purified PDTT-OPCs.
a Unsupervised clustering of the single-cell transcriptional profiles of FACS purified PDGFRα+ cells derived from hiPSCs. Visualization with a UMAP embedding divides the single cells into seven clusters. On the lower panel, co-imbedding of the hiPSC-derived data set (ipsc) with the hESC-derived PDGFR-tdTom data set from Fig. 4 shows the two data sets have overlapping cell populations. b Distribution of various genetic markers among the different clusters presented as an enrichment heatmap. All the differentially expressed genes are listed in Supplementary Data 7. c Heatmaps of GSEA show cluster-specific enrichment of OL and AS-related pathways and highlights sub-populations of OPCs that are cytokine-responsive. Detailed GSEA for all the clusters is listed in Supplementary Data 7. d GSEA enrichment plot for cytokine-mediated signaling pathway that is enriched in iP-OPC1. e Unsupervised clustering of the single-cell transcriptional profiles of D85 purified PDGFRα-tdTomato+ cells from an independent batch of differentiation. Peri pericytes, AS astrocytes, CyP Cycling progenitors, OL oligodendrocytes. f Co-imbedding of the D85 data set (hESC_10X) with the reference (generated by integrating snRNAseq-based transcriptome from three previously published data sets, Supplementary Fig. S4). Oligo oligodendrocytes, COP committed oligodendrocyte progenitors. g GSEA enrichment plot for cytokine-mediated signaling pathway that is enriched in D85-OPC1. h Heatmaps of GSEA for OPC sub-cluster (D85-OPC1) highlighting cytokine-mediated signaling pathway. Detailed GSEA for all the clusters is listed in Supplementary Data 6. c, h darker orange indicates higher enrichment.

