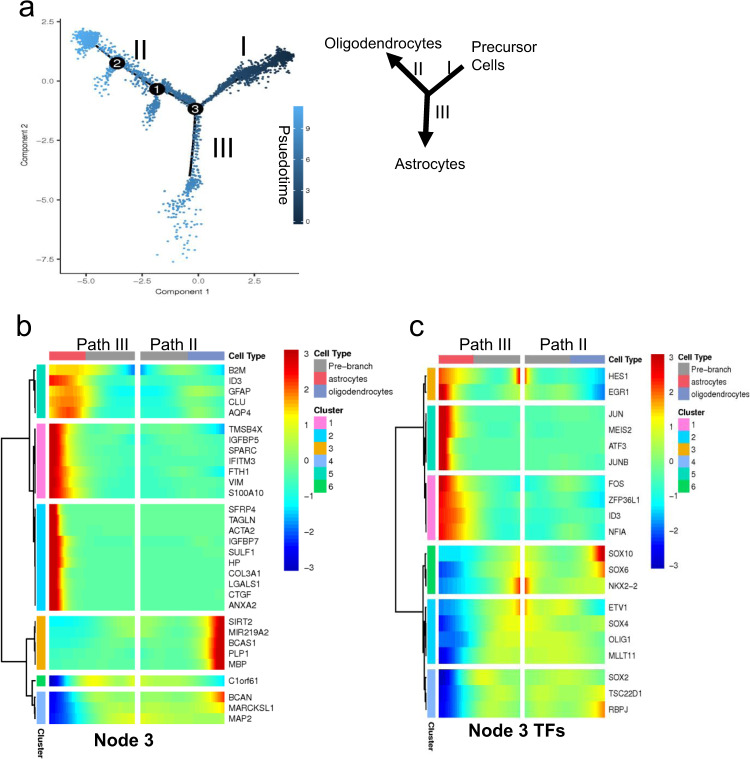
Fig. 8. Pseudotemporal trajectory analysis of the single-cell transcriptomes of the hOPCs.
a Developmental trajectories of the purified reporter OPCs generated, using Monocole-2, demonstrate two prominent paths for the OPCs. Darker colored dots (on Path I) represent developmentally younger cells and the lighter colored dots (on Paths II and III) represent more mature cells. b, c Kinetic heatmap generated using BEAM regression model capturing the most differentially expressed genes (b) and transcription factors (c) between Paths II (oligodendrocytes) and III (astrocytes). The genes are hierarchically clustered based on their expression pattern. Red color represents upregulation and blue is used for downregulation.

