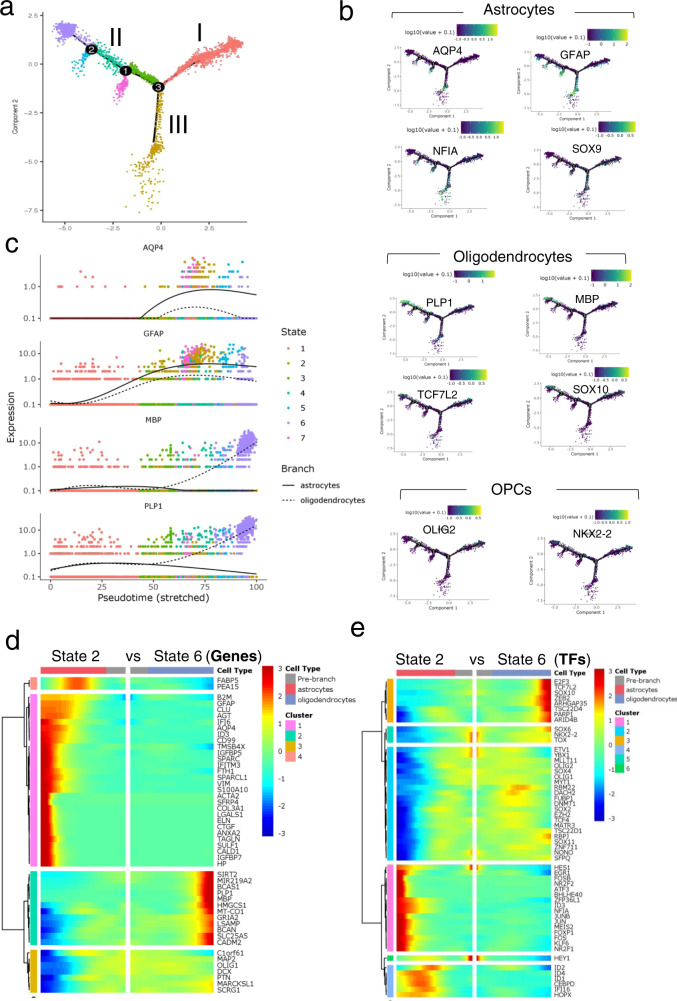
Fig. 9. Pseudotemporal trajectory of differentiation based on single-cell transcriptomes.
a Ordering cells along the trajectory divides the population into seven different states. State 1 cells are OPCs, state 2 cells are astrocytes, and state 6 cells are oligodendrocytes. b Expression of OL, astrocyte, and OPC markers within the trajectory further confirms Path III as the astrocyte and Path II as oligodendrocytes lineage cells. Astrocyte makers (GFAP, AQP4, SOX9, NFIA) are highly enriched in Path III and in the smaller branches that emerge from path II. OLLC markers (SOX10, MBP, PLP, TCF7L2) are enriched in Path II, but not in the smaller branches. Green/yellow represents enrichment. c Pseudotemporal expression pattern of OL and astrocyte genes show that the OL genes, MBP and PLP1, have similar kinetic trend and both are enriched in state 6 cells. The astrocyte marker GFAP is modeled to be expressed earlier than AQP4, although both are enriched in state 2 cells. d, e Kinetic heatmap of the most differentially expressed non-transcription factor (d) and transcription factor genes (e) between state 6 (oligodendrocyte cells) and state 2 (astrocyte cells) identified by BEAM and clustered based on their expression pattern. Red color represents upregulation and blue is used for downregulation.

