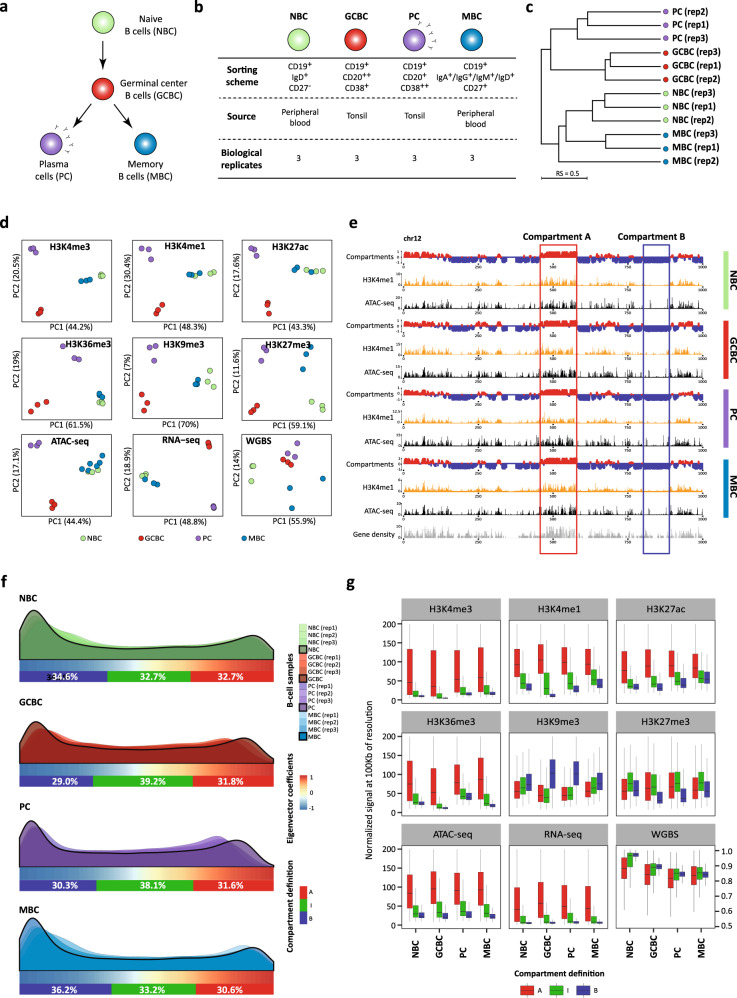
Fig. 1. Multi-omics view of B cell differentiation and identification of an intermediate compartment.
a Schematic overview of mature B cell differentiation showing the four B cell subpopulations considered in this study. b Table of sample description together with the number of in situ Hi-C replicates analyzed by each B cell subpopulations. c Dendrogram of the reproducibility scores of B cell subpopulation replicates for normalized Hi-C contact maps at 100 kb resolution. d Unsupervised principal component analysis (PCA) for nine omics layers: ChIP-seq of six histone marks (H3K4me3 n = 46,184 genomic regions, H3K4me1 n = 44,201 genomic regions, H3K27ac n = 72,222 genomic regions, H3K36me3 n = 25,945 genomic regions, H3K9me3 n = 40,704 genomic regions, and H3K27me3 n = 20,994 genomic regions), chromatin accessibility measured by ATAC-seq (n = 99,327 genomic regions), DNA methylation measured by WGBS (n = 15,089,887 CpGs) and gene expression measured by RNA-seq (n = 57,376 transcripts). e Example of chromosome 12 (chr12) comparing the eigenvector profile, H3K4me1 ChIP-seq signal, chromatin accessibility (ATAC-seq), and gene density. The red and blue rectangles highlight the features of A and B compartments, respectively. The scale indicates the genomic position in kilobase pairs (kb). f Distribution of the first eigenvector of each B cell subpopulation (three replicates and merge). The relative abundance of A-type, B-type, and intermediate (I)-type compartments per merged B cell subpopulations are indicated below each distribution. Compartment definition based on eigenvalue thresholds: A-type, +1.00 to +0.43; I-type, +0.43 to −0.63; B-type, −0.63 to −1.00. g Boxplots showing the association of the three compartments (A-type, I-type, and B-type) with each of the nine additional omics layers under study. The median signal of each layer was computed for each B cell subpopulation. For the boxplots, centerline, box limits, and whiskers represent the median, 25th, and 75th percentiles and 1.5× interquartile range, respectively. Sample sizes were NBC (naive B cells), GCBC (germinal center B cells), MBC (memory B cells), and PC (plasma cells): n = 3 biologically independent samples (all nine layers with the exception of ATAC-seq for MBC which n = 6 biologically independent samples were used).

