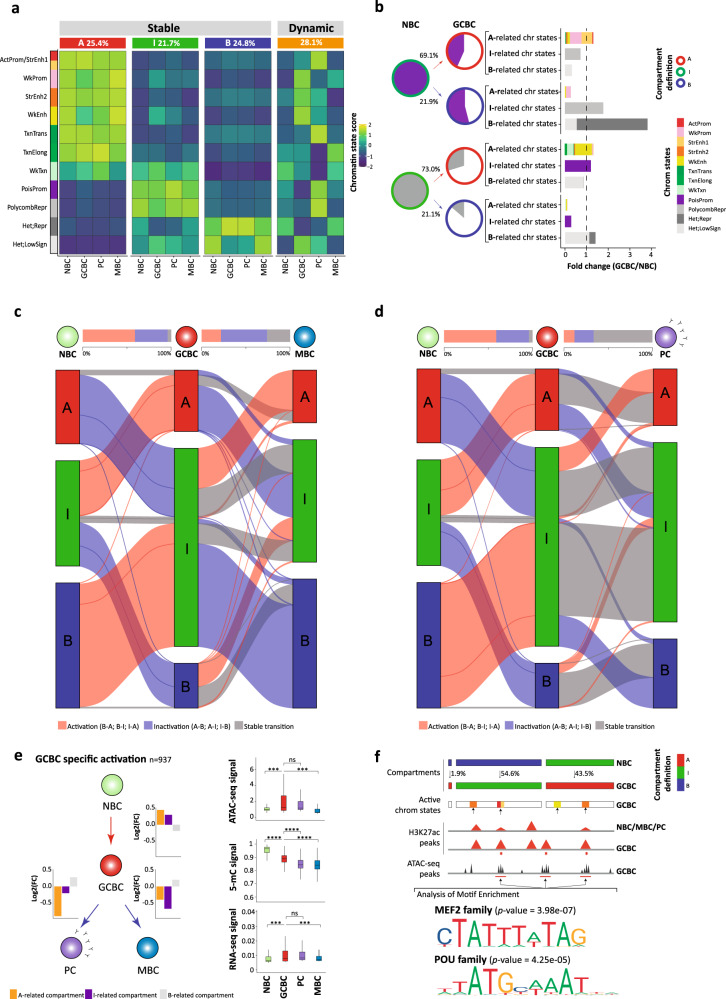
Fig. 2. Chromatin dynamics across B cell differentiation.
a Functional association of the stable (segmented into A-type, I-type, and B-type) and dynamic compartments during B cell maturation using 11 chromatin states. The percentage of each stable or dynamic compartment is indicated for all B cell subpopulations. b Intermediate compartment dynamics. The filled area of the pie charts represents the percentage of the poised promoter (top, violet) or polycomb-repressed (bottom, gray) states within the I-type compartment in NBC which shifts to A-type and B-type compartments in GCBC. The pie charts under GCBC represent the fraction that maintains the previous chromatin state (colored as previously defined) or changes chromatin states (not colored). The outline color of the pie charts represents the compartment type. Bar graphs represent the fold change between GCBC and NBC of each of the three groups of chromatin states (arranged by their relationship to the A-type, I-type, and B-type compartments). c, d Alluvial diagrams showing the compartment dynamics in the two branches of mature B cell differentiation: NBC-GCBC-MBC (c) and NBC-GCBC-PC (d). Compartment changes are represented in red if they show activation (as B-type to A-type, B-type to I-type, and I-type to A-type), in blue, in case of inactivation (as A-type to B-type, A-type to I-type, and I-type to B-type) or in gray for non-changed compartments. At the top, the bar plots between B cell subpopulations represent the total percentage of regions changing to active or inactive, and regions that conserve its previous compartment definition. e Multi-omics characterization of the 937 regions (at 100 kb resolution) gaining activity exclusively in GCBC. Left: Scheme of B cell differentiation and chromatin state dynamics, in which the bar plots indicate the log2 fold change of active, intermediate, or inactive-related chromatin state groups. Right: Boxplots of chromatin accessibility (ATAC-seq signal), DNA methylation (5-mC signal), and gene expression (RNA-seq signal) per B cell subpopulations. The median signal of each layer was computed for NBC, GCBC, PC, and MBC: n = 3 biologically independent samples (all nine layers with the exception of ATAC-seq for MBC which n = 6 biologically independent samples were used). For the boxplots, centerline, box limits, and whiskers represent the median, 25th, and 75th percentiles and 1.5× interquartile range, respectively. P values were calculated using the Wilcoxon rank-sum test (two-sided); ns nonsignificant, ***p value < 0.001, ****p value < 0.0001. f Enrichment analysis of transcription factor (TF) binding motifs. Top: Schematic representation of the analytic strategy. Bottom: Binding motifs of MEF2 and POU TF families in active and accessible loci in the GCBC specific regions gaining activity (n = 171 independent genomic loci) vs. the background (n = 268 independent genomic loci). P values were calculated using the Wilcoxon rank-sum test (one-sided). ActProm-StrEnh1 active promoter-strong enhancer 1, WkProm weak promoter, StrEnh2 strong enhancer 2, WkEnh weak enhancer, TxnTrans transcription transition, TxnElong transcription elongation, WkTxn weak transcription were A-type compartment-related states. PoisProm poised promoter, PolycombRepr polycomb-repressed were I-type compartment-related states. Het;Repr heterochromatin-repressed, Het;LowSign heterochromatin-low signal were B-type compartment-related states.

