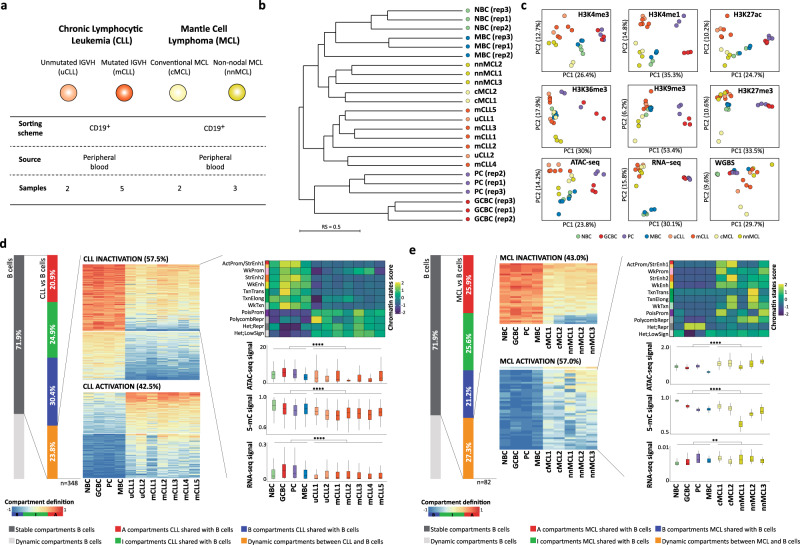
Fig. 4. Characterization of the chromatin architecture of human B cell neoplasms.
a Table of samples description together with the number of in situ Hi-C replicates analyzed by each CLL and MCL cases. b Dendrogram of the reproducibility scores for normalized Hi-C contact maps at 100 kb for B cell subpopulations replicates and samples from B cell neoplasia patients. IGHV unmutated (u)CLL; IGHV mutated (m)CLL; conventional (c)MCL and non-nodal (nn)MCL. c Unsupervised principal component analysis (PCA) for nine omics layers generated in the same patient samples as Hi-C: ChIP-seq of six histone marks (H3K4me3 n = 53,241 genomic regions, H3K4me1 n = 54,653 genomic regions, H3K27Ac n = 106,457 genomic regions, H3K36me3 n = 50,530 genomic regions, H3K9me3 n = 137,933 genomic regions, and H3K27me3 n = 117,560 genomic regions), chromatin accessibility measured by ATAC-seq (n = 140,187 genomic regions), DNA methylation measured by WGBS (n = 14,088,025 CpGs) and gene expression measured by RNA-seq (n = 57,376 transcripts). d Compartment changes upon CLL transformation. Left: First bar graph represents the percentage of stable and dynamic compartments during normal B cell differentiation. The second bar graph shows the percentage of stable and differential compartments in CLL as compared to normal B cells. A total of 23.8% of the compartments change in at least one CLL sample. Middle: Heatmaps showing eigenvector coefficients of the 348 compartments significantly losing (n = 200) or gaining (n = 148) activation in CLL samples as compared to normal B cells. Right: Multi-omics characterization of the 200 regions losing activity in CLL. Chromatin states, chromatin accessibility (ATAC-seq signal), DNA methylation (5-mC signal), and gene expression (RNA-seq signal) is shown for the CLL cases and normal B cells. The median signal of each layer was computed for NBC, GCBC, PC, and MBC while for the CLL the signal per each omics layer was considered. e Compartment changes upon MCL transformation. Left: First bar graph represents the percentage of stable and dynamic compartments in B cells. The second bar graph shows the percentage of conserved compartments between B cells and MCL. A total of 27.3% of the compartments change in at least one MCL sample. Middle: Heatmaps showing eigenvector coefficients of significant dynamic compartments between MCL and B cells (n = 82). Regions were split in two groups (MCL activation, n = 35 or inactivation, n = 47) according to the structural modulation of the MCL as compared to B cells. Right: Example of the MCL activation subset showing the chromatin states pattern, chromatin accessibility (ATAC-seq signal), DNA methylation (5-mC signal), and gene expression (RNA-seq signal). The median signal of each layer was computed for NBC, GCBC, PC, and MBC while for the MCL cases the signal per each omics layer was applied. Sample sizes were for uCLL: n = 2 biologically independent samples (all nine layers), for mCLL: n = 5 biologically independent samples (all nine layers), for cMCL: n = 2 biologically independent samples (all nine layers), for nnMCL: n = 3 biologically independent samples (all nine layers), for NBC, GCBC, PC, and MBC: n = 3 biologically independent samples (all nine layers with the exception of ATAC-seq for MBC in which n = 6 biologically independent samples were used). For the boxplots, centerline, box limits, and whiskers represent the median, 25th and 75th percentiles and 1.5× interquartile range, respectively. Comparisons were performed using the Wilcoxon rank-sum test (two-sided). **p value < 0.01, ****p value < 0.0001.

