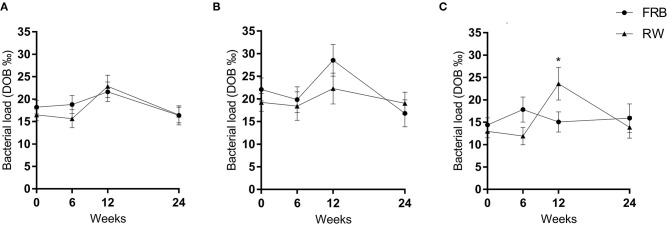
Figure 2.
Bacterial load measured 13C-urea breath test at base-line, after 6 and 12 weeks of intervention and 12 weeks post intervention (week 24) in the fermented rye bran (FRB) and in the refined wheat (RW) group among all participants (A) and across normal weight participants (B) and overweight participants (C). Data is mean ± SEM. DOB, delta-over-baseline. Statistically significant differences are indicated by *p < 0.05.

