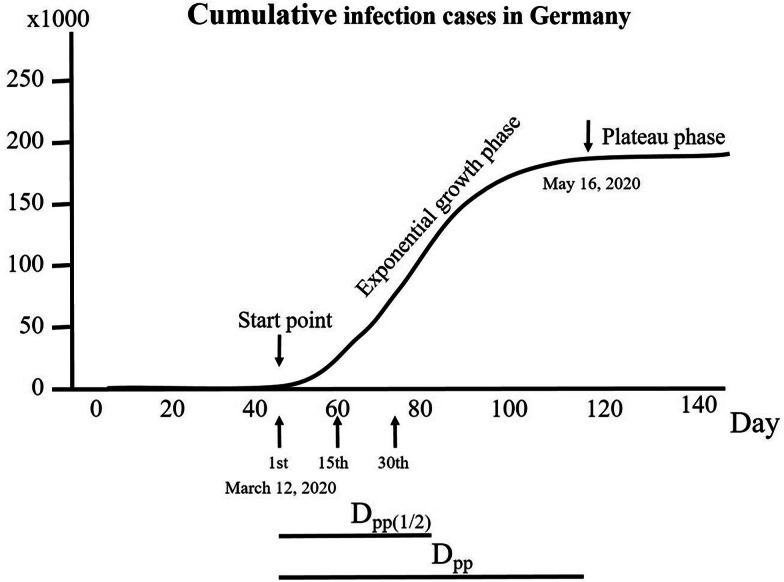
Fig. 1.
Illustration of mathematical analyses of the study parameters involving COVID-19 infection. As an example, the development of infection cases in Germany over 140 days is displayed to determine the points used for calculations. A curve with different phases can be identified from the course of cumulative infection cases. The 1st day was set as the day when the infection cases began to increase exponentially. In the early exponential phase, the infection growth factor (ICGF) was calculated. The death cases were obtained from the period between the 15th day after the start point and the 30th day. The plateau phase was reached when the course of cumulative infection cases no longer showed an exponential increase. The time interval (days) between the start point and the beginning of the plateau phase (Dpp) was calculated. Since a plateau phase was not yet reached in most countries, Dpp(1/2) was set as half the mean Dpp and calculated for all countries.

