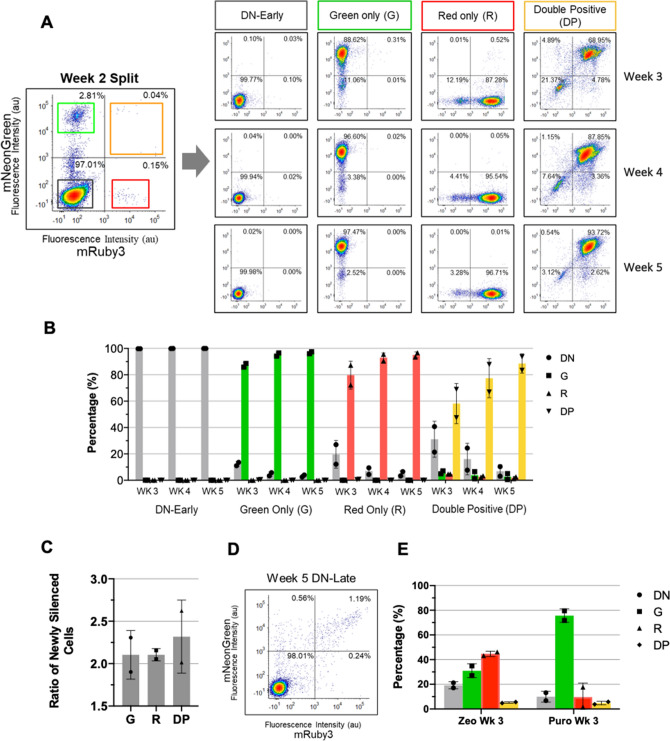
Figure 2.
Characterization of expression phenotype dynamics using screening and selective markers. (A) Transfected HEK293T cells were selected with puromycin for two weeks following transfection with our model system construct prior to sorting via FACS into four expression phenotypes (DN, G, R, and DP). Each phenotypic state was further sorted each following week until 5 weeks where cells were gated and isolated for their respective phenotype (Ex: Green only cells at week 3 were sorted for the 88.62% mNeonGreen- population and replated for sorting the following week). (B) Summary of temporal data for the DN, G, R, and DP populations, generated from biological duplicates, over 5 weeks of FACS sorting. Fluorescent percentage refers to percent of cells in specific expression phenotype. (C) Average ratios of newly silenced DN cells (from week 3 to week 4 and from week 4 to week 5). (D) Example FACS plot of a new phenotypic population isolated during the week 4 sorting process: DN-Late (refer to Fig. S1). During the week 4 sorts, the DN population of the DP cells (7.64% DN population) were additionally sorted. These cells were FACS analyzed along with the other intended cell populations during week 5. (E) Barchart displaying cytometry data for puromycin and zeocin selected cell lines detailing percentages of each phenotypic state, performed in duplicates, where cells were initially gated for all fluorescent populations at week 2 (G. R, and DP) which were plated and resorted the following week.

