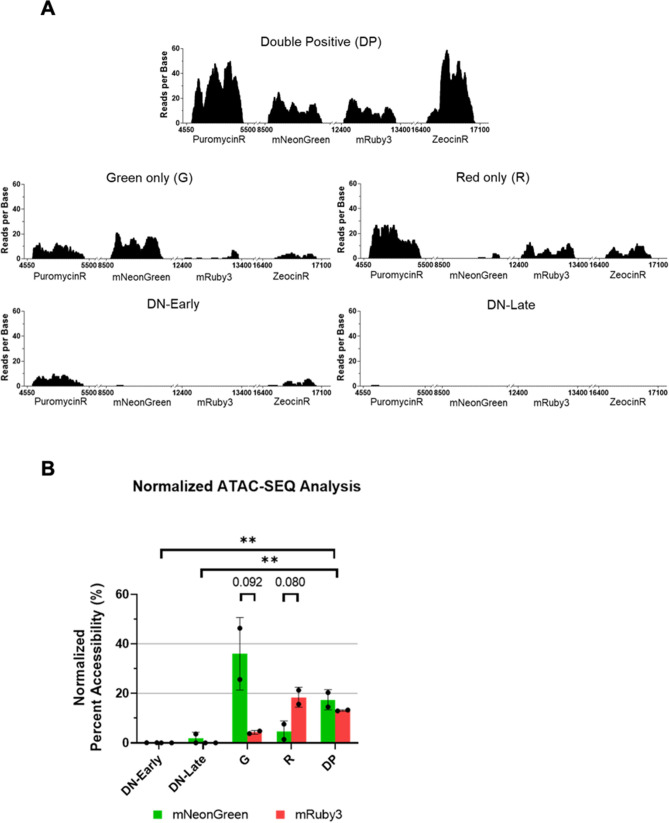
Figure 4.
ATAC-seq analysis of genomic DNA derived from sorted and enriched phenotypic populations. (A) Representative images displaying ATAC-seq reads associated with each of the constructs’ gene bodies (PuromycinR, mNeonGreen, mRuby3, and ZeocinR) generated for each of the distinct phenotypic states. (B) Comparison of fold change as it relates to chromatin accessibility looking at mNeonGreen and mRuby3 between samples. Performed in duplicate with significant changes (**p < 0.01, Bonferroni-corrected multiple t-Test) represented above.

