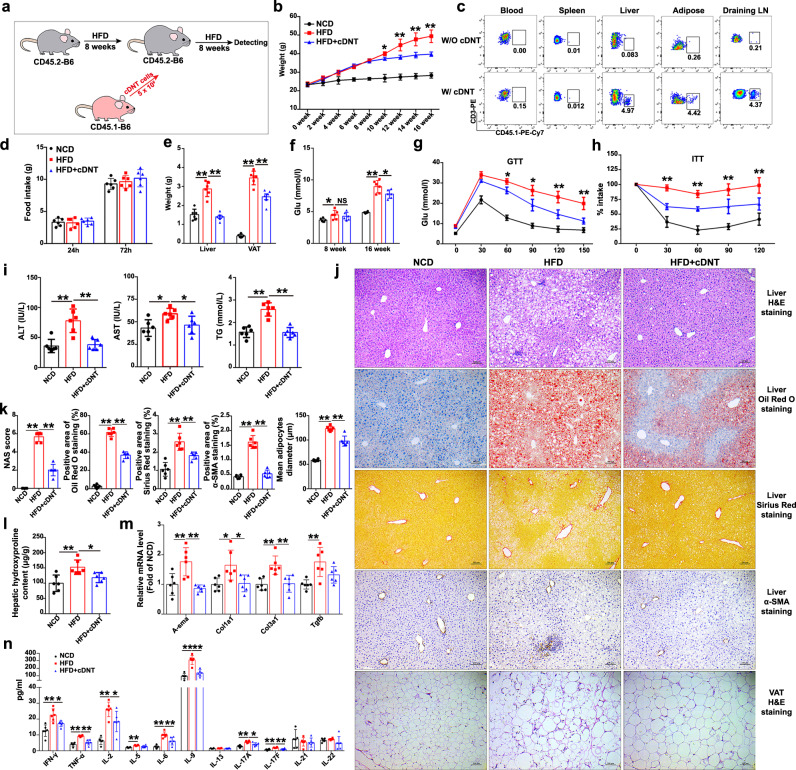
Fig. 1. Adoptive cDNT transfer alleviated obesity-induced insulin resistance and steatohepatitis in HFD-fed mice.
a Flowchart of the adoptive transfer of cDNT. b Bodyweight of mice from each group. NCD, black; HFD, red; HFD + cDNT, blue. Actual p values (left → right): 0.012, 0.00027, 0.000038, 0.000005. c The in vivo distribution of transferred cDNT in mice. d Food intake by mice from each group. e Liver and VAT weights of mice fed the NCD or HFD for 16 weeks. Actual p values (left → right): 0.000004, 0.000001, 0.000004, 0.000001. f Fasting plasma glucose levels were measured in mice fed the HFD for 8 or 16 weeks. Actual p values (left → right): 0.048, 0.78, 9.69e−8, 0.025. g, h GTTs and ITTs were performed after intraperitoneal glucose or insulin injection. Actual p values (left → right): g 0.037, 0.015, 0.0041, 0.0031; h 8.58e−8, 2.74e−7, 0.000029, 0.000097. i Plasma ALT, AST, and TG levels were measured. Actual p values (left → right): 0.00030, 0.00049, 0.015, 0.045, 0.000013, 0.000011. j Representative H&E staining, oil red o staining, Sirius red staining, α-SMA staining in liver paraffin sections, and H&E staining in VAT paraffin sections. Scale bars, 100 μm (n = 6 biologically independent samples per group). k Quantification of liver and VAT histology staining. Actual p values (left → right): 0.00065, 0.00028, 5.80e−9, 1.22e−8, 0.000010, 0.0074, 8.30e−9, 1.42e−8, 5.93e−9, 0.000029. l Hydroxyproline levels in liver tissues of each group. Actual p values (left → right): 0.0032, 0.048. m Fibrosis-related genes in liver tissues. Actual p values (left → right): 0.0052, 0.0014, 0.017, 0.024, 0.0021, 0.0030, 0.0040. n Plasma cytokines of mice in each group. Actual p values (left → right): 0.00027, 0.029, 0.000002, 0.000055, 0.000009, 0.035, 0.00069, 0.000009, 0.0049, 0.000003, 0.000036, 0.000039, 0.010, 0.00014, 0.0018. Data are presented as the mean ± SD; n = 6 mice/group. Statistical analysis for the first left figure in k (NAS score group) was performed by Kruskal–Wallis multiple comparisons test, and others were performed by one-way ANOVA with post hoc multiple comparisons test. Two-sided p values < 0.05 were considered significant. *p < 0.05; **p < 0.01. Source data, including exact p values, are provided as a Source data file.

