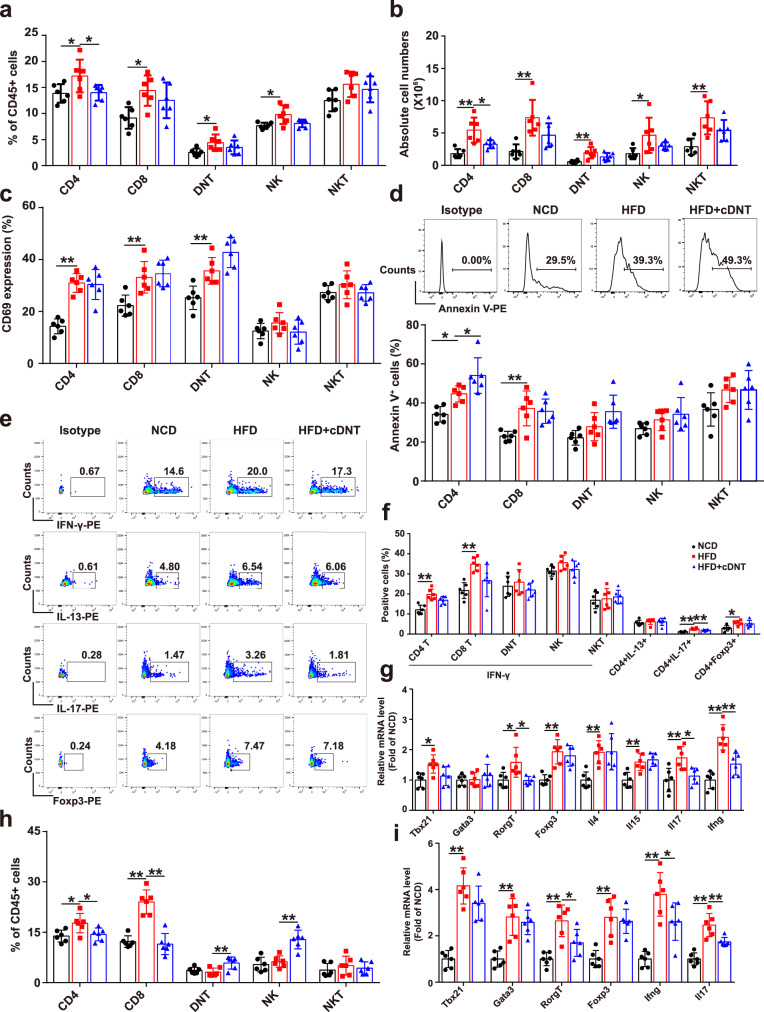
Fig. 2. cDNT transfer decreased the CD4+ T cell proportion and survival, and Th17 differentiation in liver and adipose tissue.
a Percentages of intrahepatic CD4+ T cells, CD8+ T cells, DNT, NK cells, and NKT cells relative to the total number of CD45.2+ cells in mice. NCD, black; HFD, red; HFD + cDNT, blue. Actual p values (left → right): 0.028, 0.027, 0.017, 0.033, 0.016. b Absolute numbers of CD4+ T cells, CD8+ T cells, DNT, NK cells, and NKT cells in mouse livers. Actual p values (left → right): 0.00039, 0.021, 0.0039, 0.0045, 0.026, 0.0027. c Statistical analysis of the percentages of CD69+ cells among T cells, NK cells, and NKT cells. Actual p values (left → right): 0.000019, 0.0060, 0.0094. d Representative flow cytometry plots (top) and statistical analysis (bottom) of Annexin V+ cells relative to total T cells, NK cells, and NKT cells in each group. Actual p values (left → right): 0.027, 0.047, 0.0045. e, f Representative flow cytometry plots (e) and statistical analysis (f) of the percentages of IFN-γ+, IL-13+, IL-17+, and Foxp3+ cells among liver infiltrated T cells. Actual p values (left → right): f 0.00013, 0.00013, 0.000006, 0.0081, 0.015. g Real-time PCR analysis of related genes in livers from mice in each group. Actual p values (left → right): 0.015, 0.016, 0.012, 0.00041, 0.0066, 0.0029, 0.0063, 0.024, 0.000016, 0.0017. h Percentages of T cells, NK cells, and NKT cells among CD45.2+ cells from adipose tissue. Actual p values (left → right): 0.021, 0.034, 0.000013, 0.000006, 0.0092, 0.00042. i Relative mRNA levels of Tbx21, Gata3, Foxp3, RORγt, Ifng, and Il17 in adipose tissue. Actual p values (left → right): 0.000038, 0.00022, 0.00027, 0.022, 0.00028, 0.000026, 0.037, 0.000007, 0.0065. Data are presented as the mean ± SD; n = 6 mice/group. Statistical analysis for b of CD8 group, d of DNT group, and g of Rorgt group was performed by Kruskal–Wallis multiple comparisons test, and others were performed by one-way ANOVA with post hoc multiple comparisons test. Two-sided p values < 0.05 were considered significant. *p < 0.05; **p < 0.01. Source data, including exact p values, are provided as a Source data file.

